
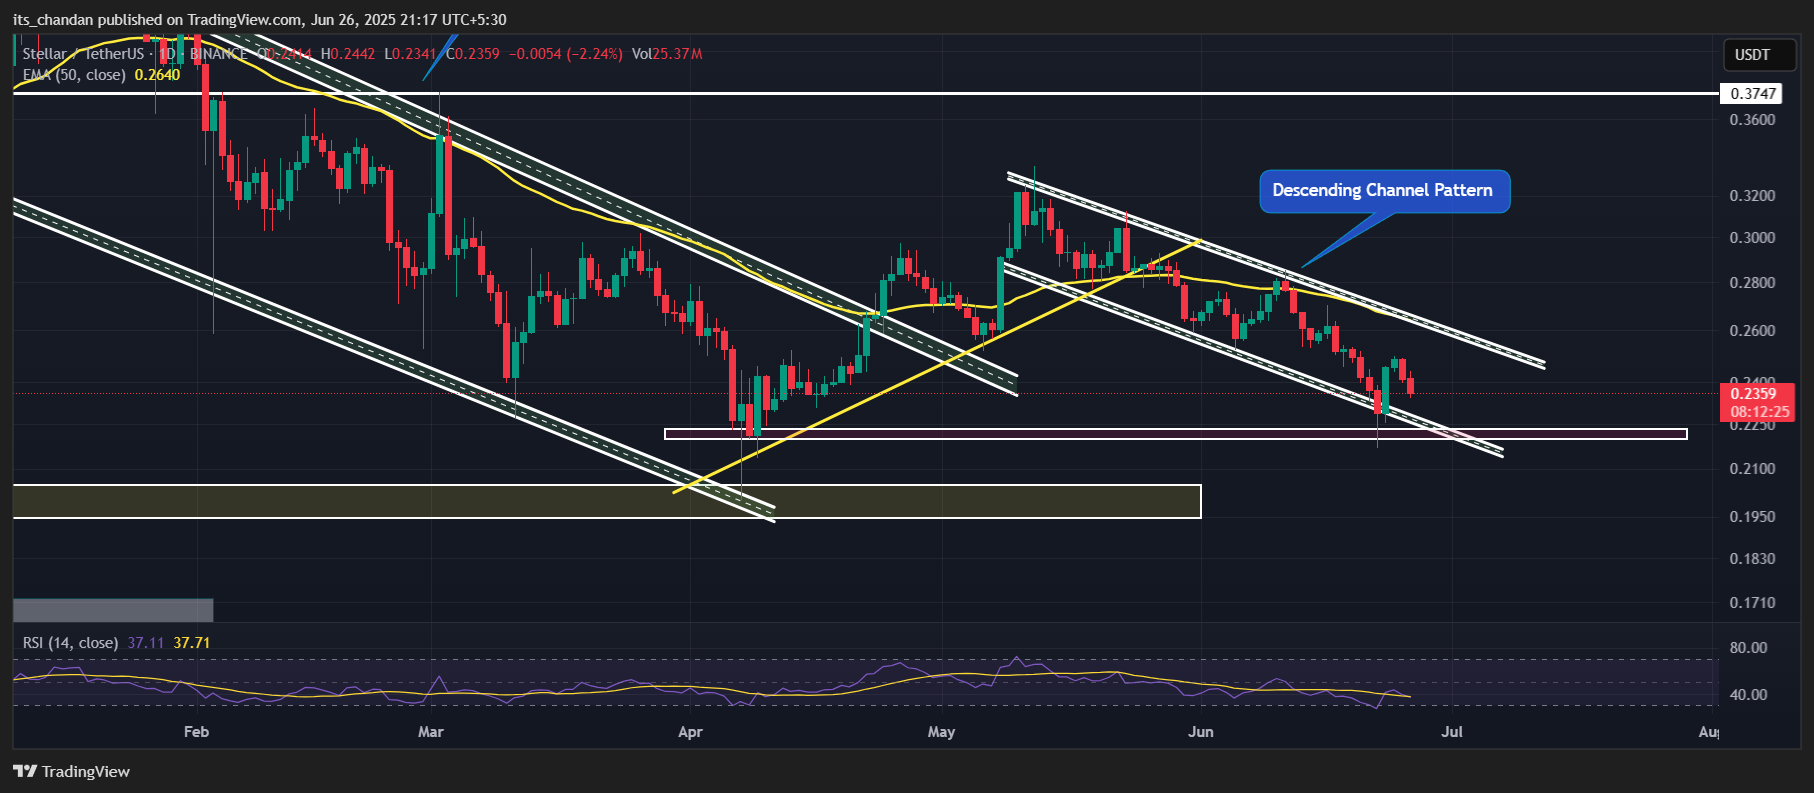
Amid the ongoing geopolitical tension, XLM crypto price appears to be continuing its prolonged bearish trend following the formation of a bearish price action pattern. The daily chart reveals that the asset has been moving within a descending channel pattern since May 2025, fluctuating between its upper and lower boundaries.
Current Price Momentum
At press time, the XLM crypto price was trading near $0.236, having lost over 3.10% in value over the past 24 hours. Meanwhile, during this period, participation from traders and investors also declined, leading to a 7% drop in trading volume compared to the previous day.
This drop in the trading volume, along with the price decline, hints at weakening investor confidence and the possibility of further downside in the near term. Additionally, it also shows weak downside momentum of the asset.
XLM Price Action and Key Technical Levels
According to expert technical analysis, XLM appears bearish and is poised to continue its downside momentum due to its bearish price action pattern. On the daily chart, the asset has been hovering within a channel pattern between the upper and lower boundaries.
However, XLM’s price recently soared following the ceasefire announcement between Israel and Iran, but it seems to have failed to sustain the momentum and now appears to be heading toward the lower boundary.
XLM Crypto Price Prediction
Based on recent price action, if the sentiment remains unchanged and the price continues to fall, there is a strong possibility that XLM could experience a modest drop of 7%, potentially reaching the key support level of $0.22, a level last seen during the previous market crash.
On the other hand, if the sentiment shifts and XLM ends its bearish streak and continues to rise, it could see a 10% price surge and reach the upper boundary of the channel pattern.
Technical Analysis: 50 EMA and RSI Insights
At press time, XLM crypto price is trading below the 50-day Exponential Moving Average (EMA) on a daily time frame, indicating an overall bearish trend and potential continuation of downward momentum. This suggests that sellers remain in control, and unless the price reclaims this key moving average as support, the asset may struggle to attract bullish interest or initiate a sustainable recovery.
Whereas, the asset’s Relative Strength Index (RSI) stands at 37, indicating that it is approaching the oversold territory, which could signal weakening selling pressure and a potential for a short-term bounce or consolidation if buyers step in.
Also Read: Notcoin Price Could Soar 100%, What On-Chain Metrics Reveal
Bullish On-Chain Metrics
Given the current market sentiment, it appears that investors and traders hold a bullish view, as they seem to be accumulating and betting on long positions, according to on-chain analytics data from Coinglass.
$2.50 Million Worth of XLM Outflow
Data from spot inflow/outflow reveals that exchanges across the crypto landscape have recorded an outflow of $2.50 million worth of XLM tokens in the past 48 hours. This substantial outflow of XLM hints at potential accumulation by investors amid the price dip.
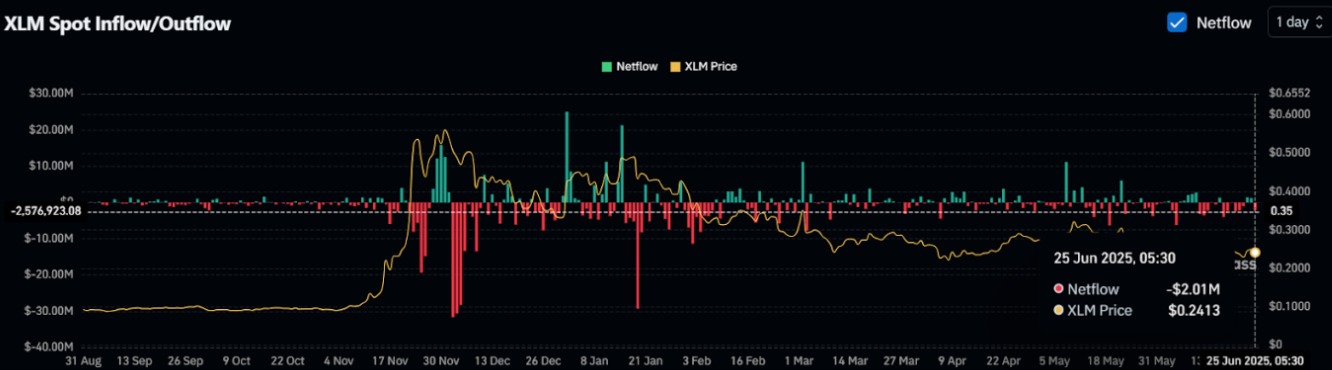
Additionally, it may reduce selling pressure and increase buyer interest, which could help XLM’s price rise if market sentiment shifts.
Traders Strong Bet on Long Positions
Meanwhile, on-chain metrics reveal that traders betting on long positions significantly outnumber those on short positions. At press time, traders are over-leveraged at $0.2313 on the lower side (support) and $0.2406 on the upper side (resistance).
These levels appear to be key zones, acting as strong support and resistance, where traders have built $1.35 million worth of long positions and $642,000 worth of short positions over the past 24 hours.
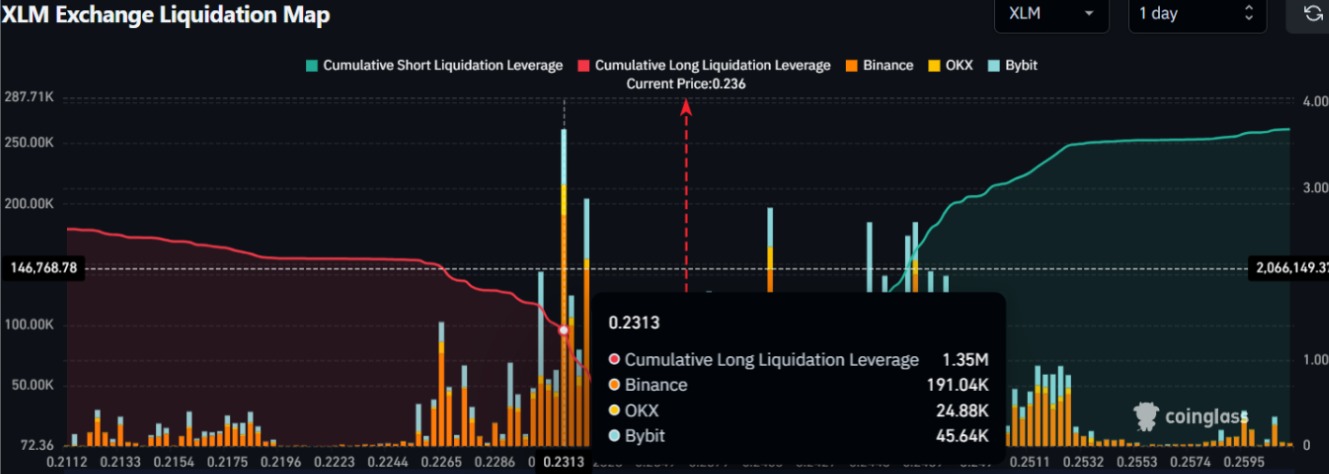
XLM Exchange Liquidation Map | Source: Coinglass
When combining these on-chain metrics, it appears that the bulls are currently dominating and seizing the dip as an opportunity to follow a buy-the-dip strategy.