With a recent 14% upside momentum, Solana (SOL) has reached a make-or-break level at $145. This level is crucial for the asset’s upcoming movement, as it serves as both a horizontal resistance and the upper boundary of a descending channel pattern. Additionally, this level also acts as the neckline of a bearish head and shoulders pattern, which the price now appears to be retesting.
This key level appears to be raising concerns about a potential sell-off and a possible price decline.
Current price momentum
At press time, SOL is trading near $144.30 and has recorded a modest price surge of over 2.35% in the past 24 hours. Despite the price increase, investor and trader participation remains low. Data from CoinMarketCap reveals that SOL’s 24-hour trading volume has dropped by 15% compared to the previous day.
This drop in trading volume hints at weak upside momentum and also suggests that traders and investors are potentially waiting for clear signals—either bullish or bearish—which could appear only after a breakout or the formation of a bearish candlestick pattern.
Also Read: Will BONK Crypto Crash? Here’s What Experts Say
Solana (SOL) price action and technical analysis
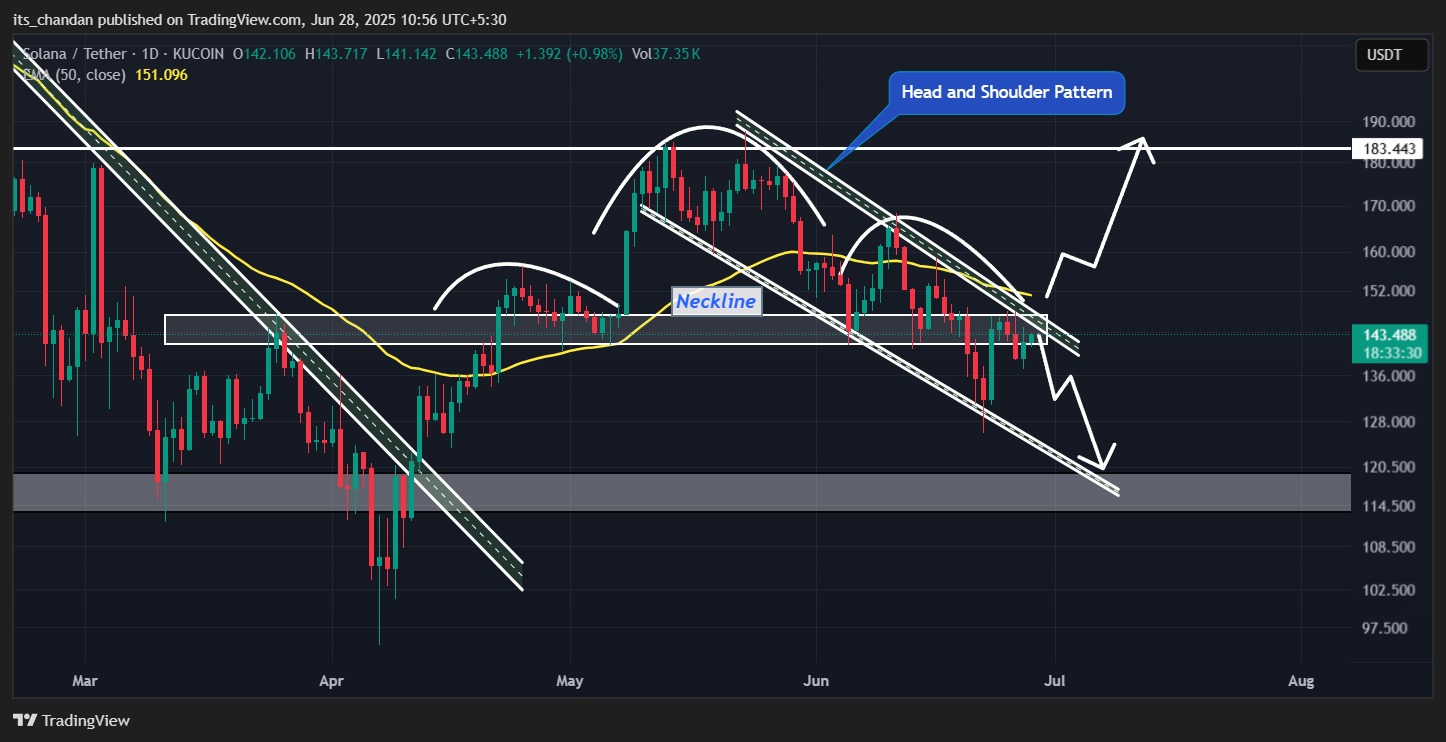
According to Crypto Time Now’s technical analysis, SOL has been displaying two bearish setups and is also on the verge of shifting this bearish trend to a bullish one.
On the daily chart, SOL appears to be hovering within a descending channel pattern between its upper and lower boundaries. In addition to this, it has also broken below the neckline of a bearish head and shoulders pattern.
With the recent upside momentum, the asset’s price has reached the upper boundary of the bearish pattern, which has a history of triggering price reversals.
Since May 2025, SOL’s price has touched this upper boundary multiple times, and each time it has experienced a downward move. Additionally, based on the head and shoulders pattern, the price appears to be retesting the neckline.
Solana keys technical levels
Based on recent price action and historical patterns, a price reversal is likely only if SOL fails to close a daily candle above the $148 level. If this happens, there is a strong possibility that history could repeat itself.
However, if the ongoing rally continues and the price breaks out of the upper boundary, it could end its prolonged bearish trend and may see an upside momentum of over 20%, potentially reaching the $184 level.
So far, SOL is currently trading below the 50-day Exponential Moving Average (EMA) on the daily timeframe, which suggests that the asset is in a downtrend.
Meanwhile, the Relative Strength Index (RSI) stands at 46, indicating that the asset is moving away from the oversold area and may continue its upside momentum.
Expert predicts bullish reversal toward $150–$160
Given the current market sentiment, several posts have surfaced on X (formerly Twitter). Recently, an expert was seen saying that SOL is flashing signs of recovery.
In a post on X, the expert noted, “ Solana (SOL) is showing signs of recovery after hitting the major low at $125.99. A potential W-shaped pattern is forming again, hinting at a bullish reversal toward the $150–160 zone.”
$20 million SOL move into exchanges, sell-off incoming?
However, investors and long-term holders appear to be opposing this bullish outlook, as they are seen dumping Solana (SOL) on exchanges.
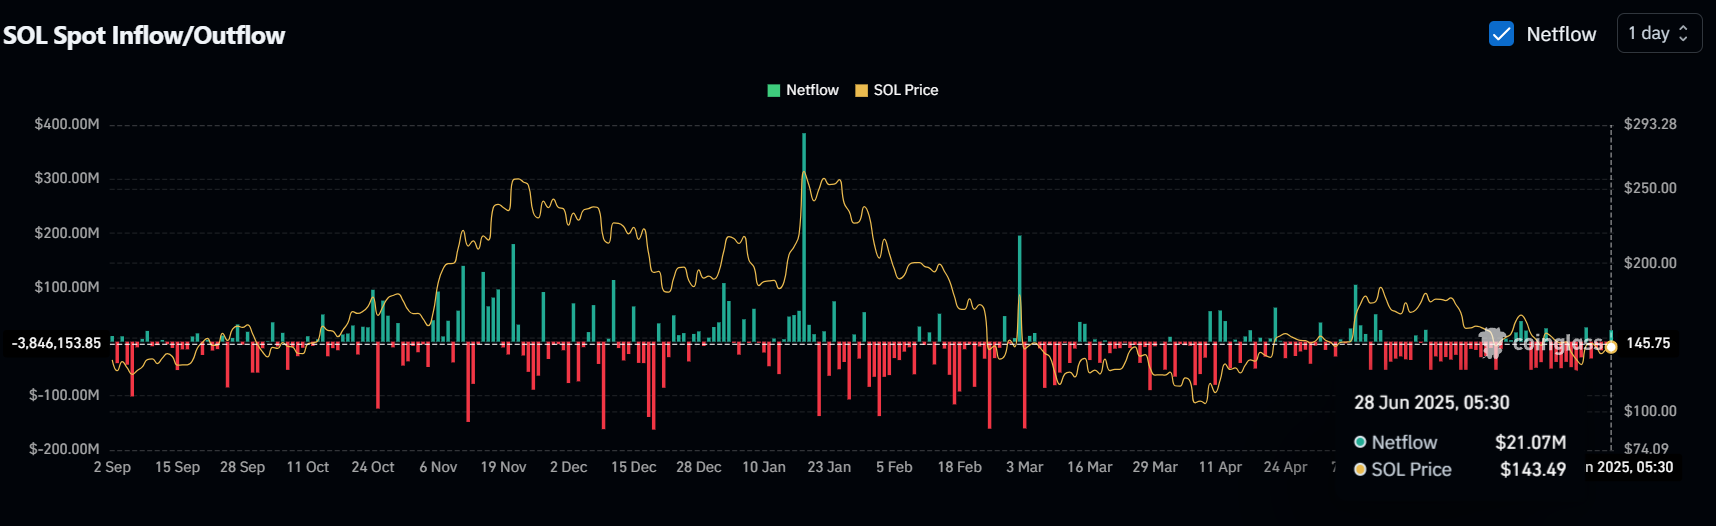
Data from Coinglass reveals that exchanges across the crypto landscape have witnessed an inflow of $21.07 million worth of SOL in the past 24 hours. This substantial inflow into exchanges indicates potential dumping, which could create selling pressure and cause the asset to continue its downward momentum.