Sui has led the number of stablecoins transferred monthly, entering a new record, at 224.18 billion as of July 2025. This is more than Solana for the first time.
As statistics from Artemis indicate, it is the first time in history that Layer 1 and Layer 2 chains have experienced such a significant level of activity. Behind Solana and closely at the second position was $210.20 billion, followed by Arbitrum at 3 with $92.87 billion. Avalanche followed with 4 at 58.91 billion and TON at 5 in 2.75 billion currency.
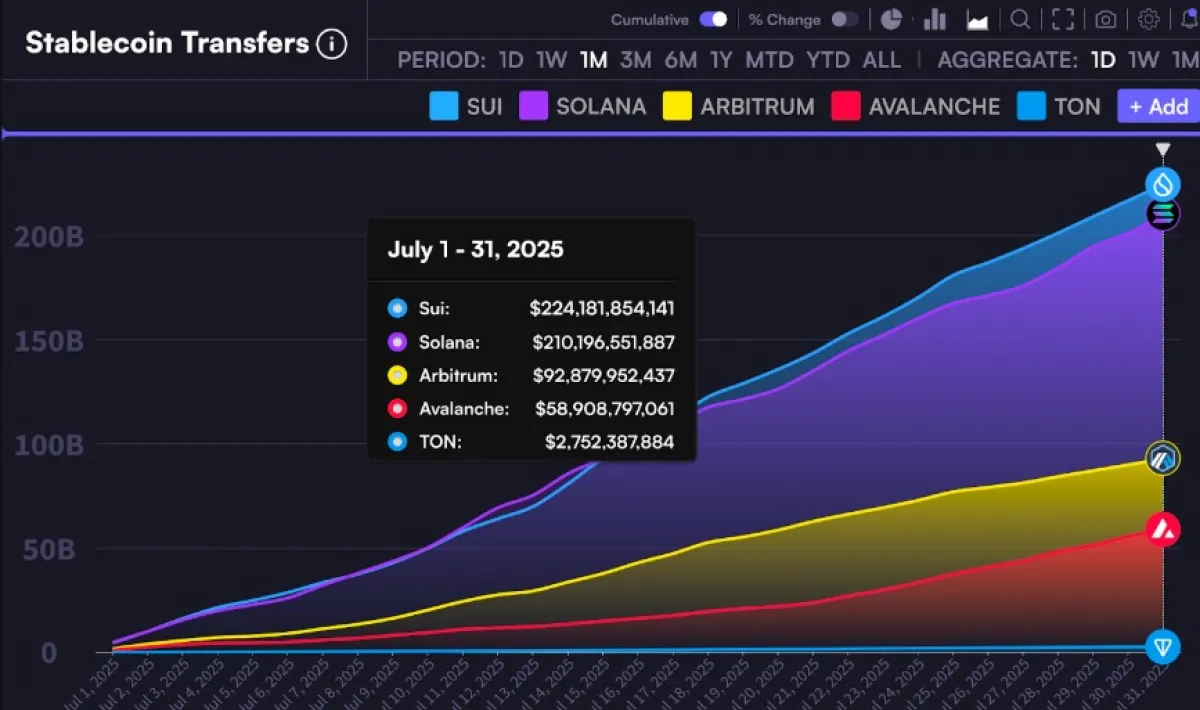
The statistics are represented by a growing trend of cumulative transfers of stablecoins by a consistent upward trend over the month. This is with a clear tendency of increasing proportionally beyond Solana halfway through July and expanding towards the month-end.
Market Impact Reflected in Price Movements
Looking at charts, we see that after reaching the heights of over $4.20 in the mid of July, the asset went back to $3.28, as of August 1. This came after testing the recent resistance zone, which has been rejected multiple times since April 2024.
The recent rally in the last few months was supported by a growing parallel channel from the last week of June to the mid of July. However, as the positive power goes through diminution beneath this channel, it indicates that selling has become substantial.
The price has now shifted to probe the low figure of $3.20 and $3.30, which may provide temporary support. Any price hit lower than this has a chance of taking the SUI price above the second significant area of demand in between $2.20 and $2.40, where massive volume has been driven in the past.
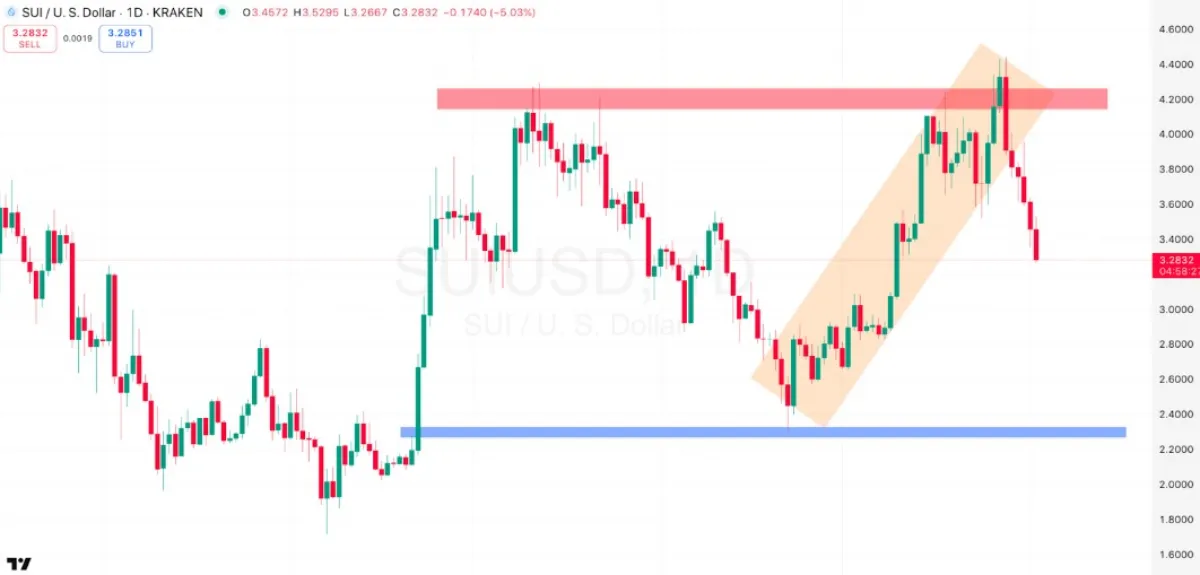
However, it could prove hard at the moment to break above $3.20; otherwise, it will contravene lower holding zones. The nearest related area of support is near the price of $2.25, as well as last May’s lows.
A retest like this would endanger most of the performance in July, but gave new hope as it would increase the buying interest when the on-chain indicators also remained high. The current resistance is one of the causes for the price to rise in the short term.
The relative strength index (RSI) in a daily chart has also weakened, hence means that the asset would be in the oversold area in the event that an extension of the drawdown initiates.
Liquidation Events Reinforce Volatility Narrative
Liquidation charts further confirm how brutal the price volatility has been in the past days. On July 31, SUI underwent one of the largest long liquidations of that month, amounting to more than $17 million.
This was accompanied by a sharp decline in the Sui price, which was forced towards the $4.00 mark as a result of forced sales against leveraged positions. The figures show that until the end of July, liquidation volumes were fairly balanced, with the bets going long too long.
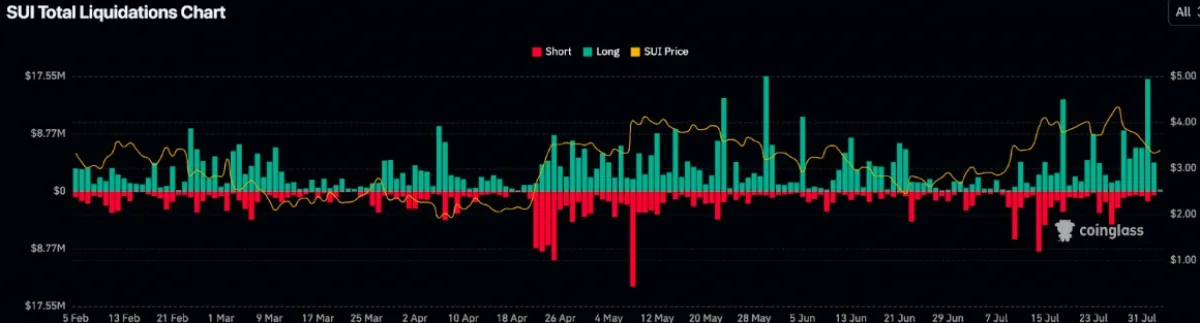
The entire month of July, liquidation spikes have had an increased correlation with the SUI price volatility. This has already been observed in the chart since July 21, where there is a build-up of levered positions on the long side, perhaps in anticipation of a breakout on the long side to last.
However, a limit was reached when the prices swung harder, having touched the red resistance area at the levels of $4.30-$4.40. The reversal is now in a growth direction, already wiped away in slump trades to the bottom. This brought about a cash crunch as the price went down to below $3.30.
Also read: Can Solana Crypto Reclaim $200? Key Indicators Say Yes