Solana price prediction has been the center of attraction as the market responded to consecutive bearish technical patterns. Additionally, the asset’s price extended decline in June attracted the attention of multiple analysts regarding critical support zones and a possible reversal setup.
Breakdown Below $140 Sparks Bearish Solana Outlook
According to analyst CryptosBatman’s Solana price prediction, the altcoin had recently fallen under a major horizontal support line of $140. A series of red candles in June accompanied this breakdown, indicating a strong selling momentum.
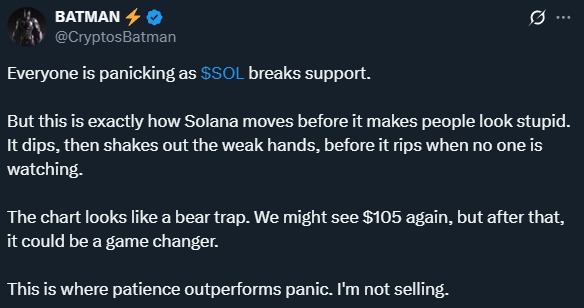
In addition, the analyst indicated that Solana price prediction was on the verge of testing a former demand region at around $105. This level provided support in March 2025, and it could potentially act to be a reactionary point to buyers.
More so, a projected V-shaped recovery path is illustrated in the chart. The path begins with a dip to $105, followed by a sharp reversal reclaiming the $140 level and targeting $160.
Further, the analyst outlined a potential bear-trap scenario. If the SOL price prediction surges past $160, a broader bullish structure could form, setting $260 to $295.83 as medium-term resistance levels.
Also Read: Chainlink Price Prediction: Will LINK Hit $20 Next?
Solana Price Prediction Eyes HTF Demand Zone Between $115–$130
Furthermore, analyst CryptelligenceX showed that Solana price retraced from the anchored VWAP drawn from the all-time high (ATH). The rejection occurred near the $158–$160 resistance band, triggering a notable -11.34% candle close down to $135.70.
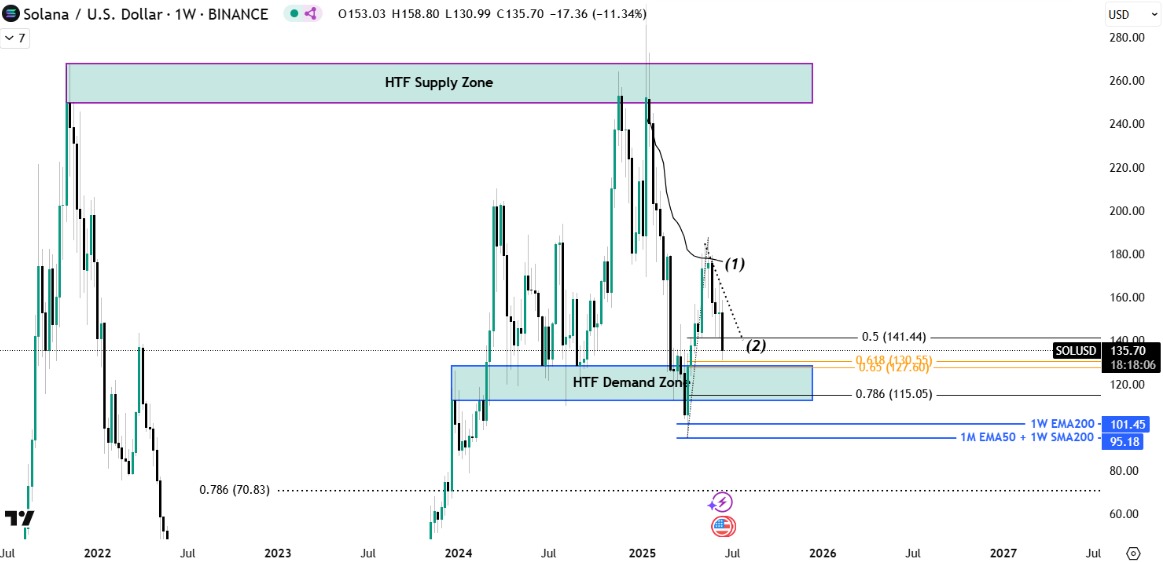
Meanwhile, the analyst has marked the high time frame (HTF) demand zone between the levels of $115 and $130. This base has been an accumulation range, and there are multiple confluences aligned.
Besides, multiple Fibonacci retracement levels cluster within this zone. The 0.618 level is at $130.55, while 0.65 lies slightly lower at $127.60, both residing inside the HTF demand region.
Additional downside support included the 0.786 level at $115.05. While longer-term moving averages add to the structure, the 1W EMA200 at $101.45 and the 1M EMA50/1W SMA200 convergence at $95.18.
Head and Shoulders Breakdown Confirms Bearish Structure
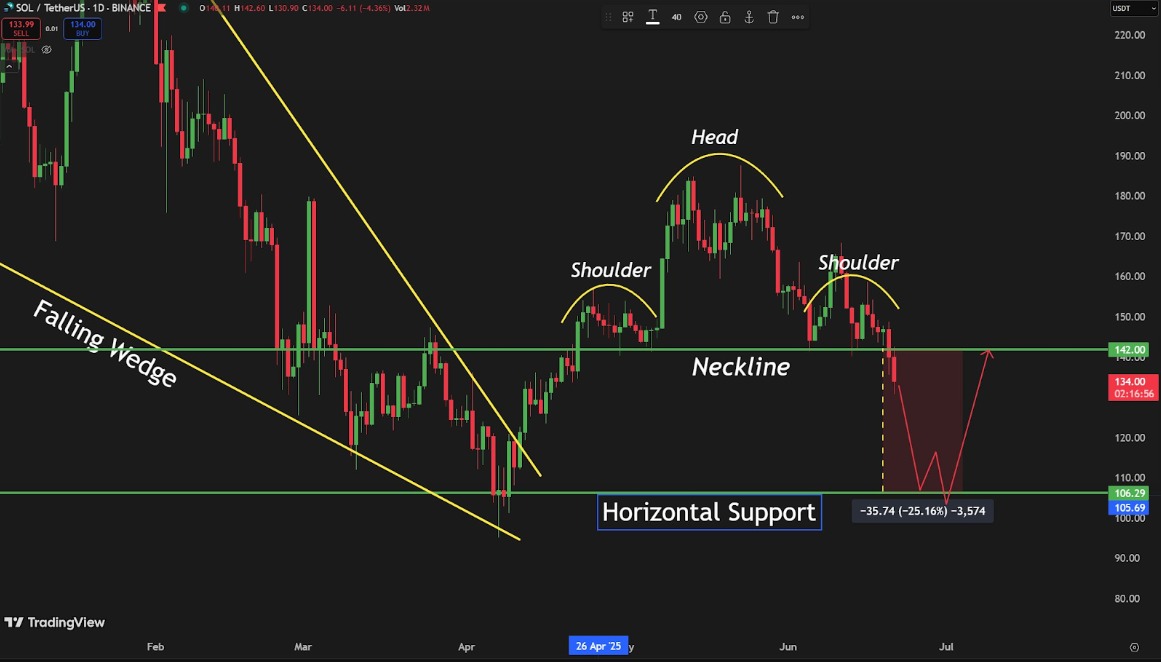
Also, analyst TheMoonCarl outlined a clear Head and Shoulders Solana price prediction formation. The left shoulder formed near $160, while the head peaked above $190, and the right shoulder reached around $165.
On the other hand, the neckline is drawn at approximately $142. A decisive break and candle close below this level confirmed the bearish structure for Solana price prediction.
Solana Price Prediction Chart | Source: X
Post-breakdown, Solana price quickly declined to $134. The analyst projected a 25.16% downside move from the neckline to a bearish target near $106.30.
Conseque, a previously observed falling wedge breakout that led to the head, has since lost momentum. Current Solana price prediction suggests weakening bullish follow-through, with focus now on the $106 area as a support test.
Short-Term Indicators Confirm Bearish Solana Price Prediction
Subsequently, on Solana price prediction, the asset has trended below the medium Bollinger Bands line. SOL price of $133.32 showed multiple rejections on the 20-period simple moving average (SMA), which is an indication of active downward pressure.
Additionally, the lower Bollinger Band that is in the vicinity of $131.59 has served as dynamic support. Comparatively, the high band of $150.23 was not put to the test, which indicated the absence of recent bullish pressure.
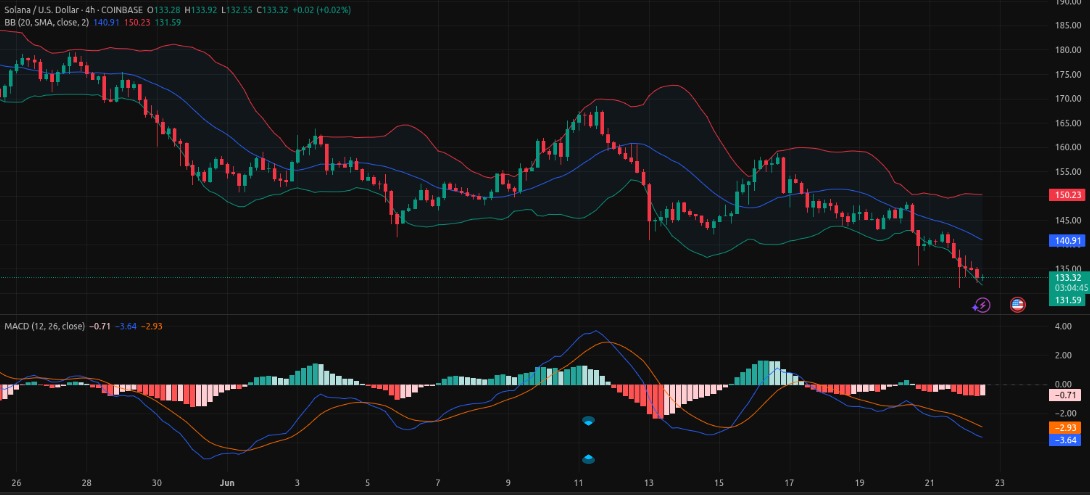
The MACD (12, 26) indicated ongoing bearish momentum. The MACD line is at -3.64, beneath the signal line at -2.93, with histogram bars still negative.
Although the bars in the histogram are becoming small, there is no established crossover or divergence. This continued to favour the sellers in the short run. Solana price prediction is tilted downside unless a renewed recovery is established beyond the mark of $140.