
PEPE coin price demonstrated a positive trend as a falling wedge pattern was broken at around the $0.00001235 mark. Analysts have indicated a probable trend to $0.00002843 since similar chart trends have led to sharp rallies in the past.
PEPE Coin Price Falling Wedge Breakout
Notably, PEPE coin price recently exited a falling wedge pattern, a structure that is commonly linked to a trend reversal when it is followed by a downtrend. The breakout occurred around the $0.00001235 level, an area that has been a major accumulation point in the past. The shift showed a reversal of the trend where buyers regained the initiative in a clear support zone.
In addition, analyst PepeCZBinance confirmed this breakout was after a period of compression in which price volatility had declined. The Falling wedge was marked by the narrowing of the lower highs and lows, which were eventually broken.
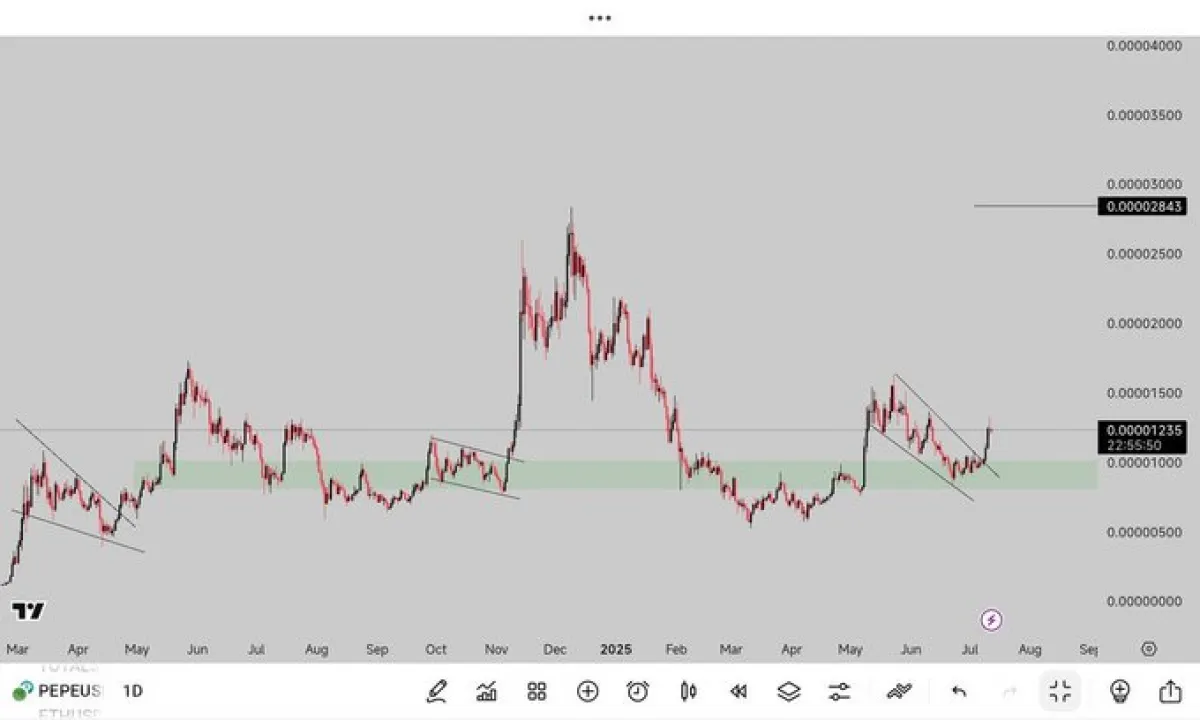
Based on this pattern, the technical projection of the target was about 0.00002843, based on the height of the wedge formation plus the breakout point. Nevertheless, to maintain the move, that price has to stay above $0.00001150, currently in effect as a retest level.
Also Read: Altseason Incoming? Total3 Breaks 224-Day Consolidation
Previous Breakouts Suggest Pattern Continuity
More so, historical PEPE coin price movements shared by Mister Crypto suggest a recurring structure of falling wedges followed by vertical upward rallies. At least two major wedge formations over the past year preceded rapid gains.
Notably, the price doubles in a short span after each breakout. These patterns were marked by a similar duration and structure, giving some credibility to the potential of this third setup.
Moreover, visual data from past chart cycles showed nearly identical characteristics. Each wedge consolidation phase was followed by strong bullish candles, triggering multi-week rallies.
Consequently, the current pattern had a resemblance to those earlier moves in both timing and structure, suggesting that this may not be an isolated event. The presence of the green arrow markers in the chart analysis reflected how previous reversals originated from similar patterns, adding weight to the current breakout setup.
Surge in Derivatives Volume Strengthens Bullish Case
Meanwhile, increased trading was observed on the PEPE derivatives market. Over the last 24 hours, Coinglass data indicated that the volume increased by 50%, to a total of 3.43 billion.
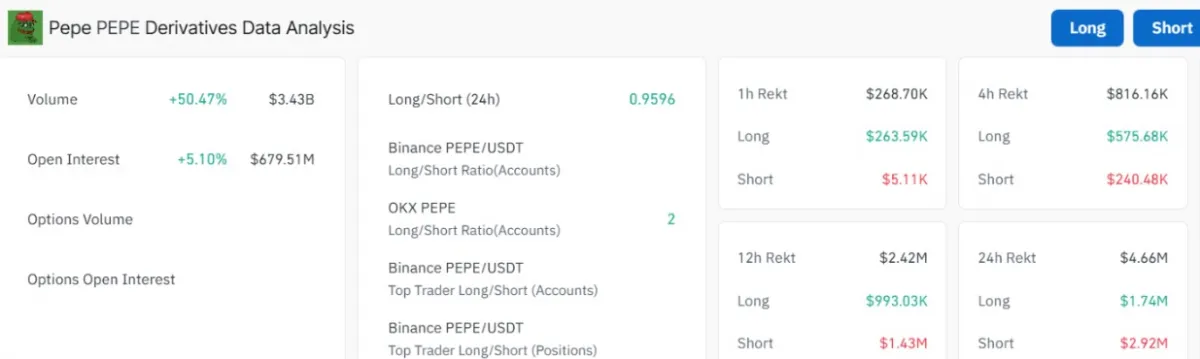
Simultaneously, the open interest rose by 5.10% to 679.51 million, meaning new funds were coming into the market and speculative positioning increased. This inflow was consistent with the wedge break and can support the direction of the PEPE coin price.
Additionally, short liquidations increased price pressure. Short liquidations were $2.92 million in the last 24 hours, compared to the longs at 1.74 million. Subsequently, this imbalance showed that a sizable number of bearish positions were liquidated by the sudden breakout, contributing to upward momentum.
Exchange Positioning Revealed Trader Expectations
Moreover, the long-to-short ratio on the major exchanges like OKX and Binance showed mixed sentiment. On Binance, the 24-hour long/short ratio stood at 0.9596, indicating a near-even distribution between bullish and bearish positions.
However, on OKX, the ratio was at 2.0 and indicated that traders on this platform had a more bullish stance on the short-term performance of PEPE.
Top trader positioning also supported the divergence. The top trader long/short data at Binance was balanced between the accounts, and highly biased toward the longs at OKX. Should this positioning stay firm or rise with increased open interests, it can facilitate an ongoing rally to the forecasted target at $0.00002843.