Amid ongoing market uncertainty, Hyperlink (HYPE) appears bullish and seems to be forming a bullish price action pattern on the daily time frame. HYPE’s strong upside potential has garnered significant attention from traders and investors.
Experts Predict New All-Time High for HYPE
Given the current market sentiment, experts and analysts have been making bold predictions on X (formerly Twitter), which have gained widespread attention.
In one post, a crypto expert shared that HYPE has reclaimed the range low and is currently forming a textbook ascending triangle price action pattern. The post further added that an all-time high could be incoming for the HYPE coin.
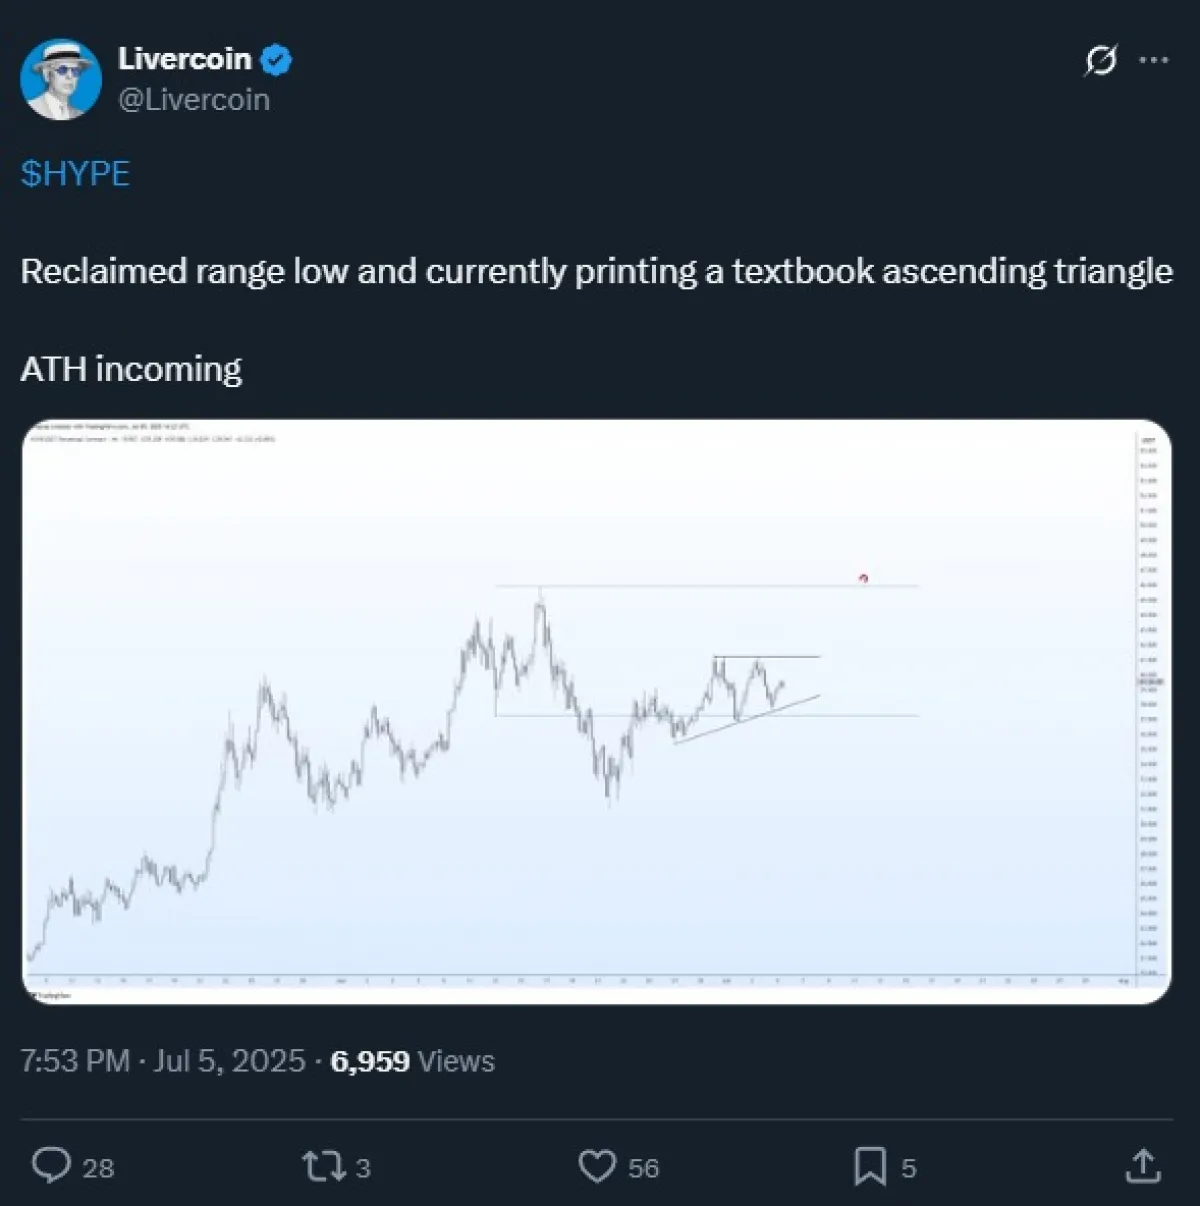
This bold prediction for HYPE price on X spread like wildfire, as several more predictions and optimistic commentaries appeared in the comment section.
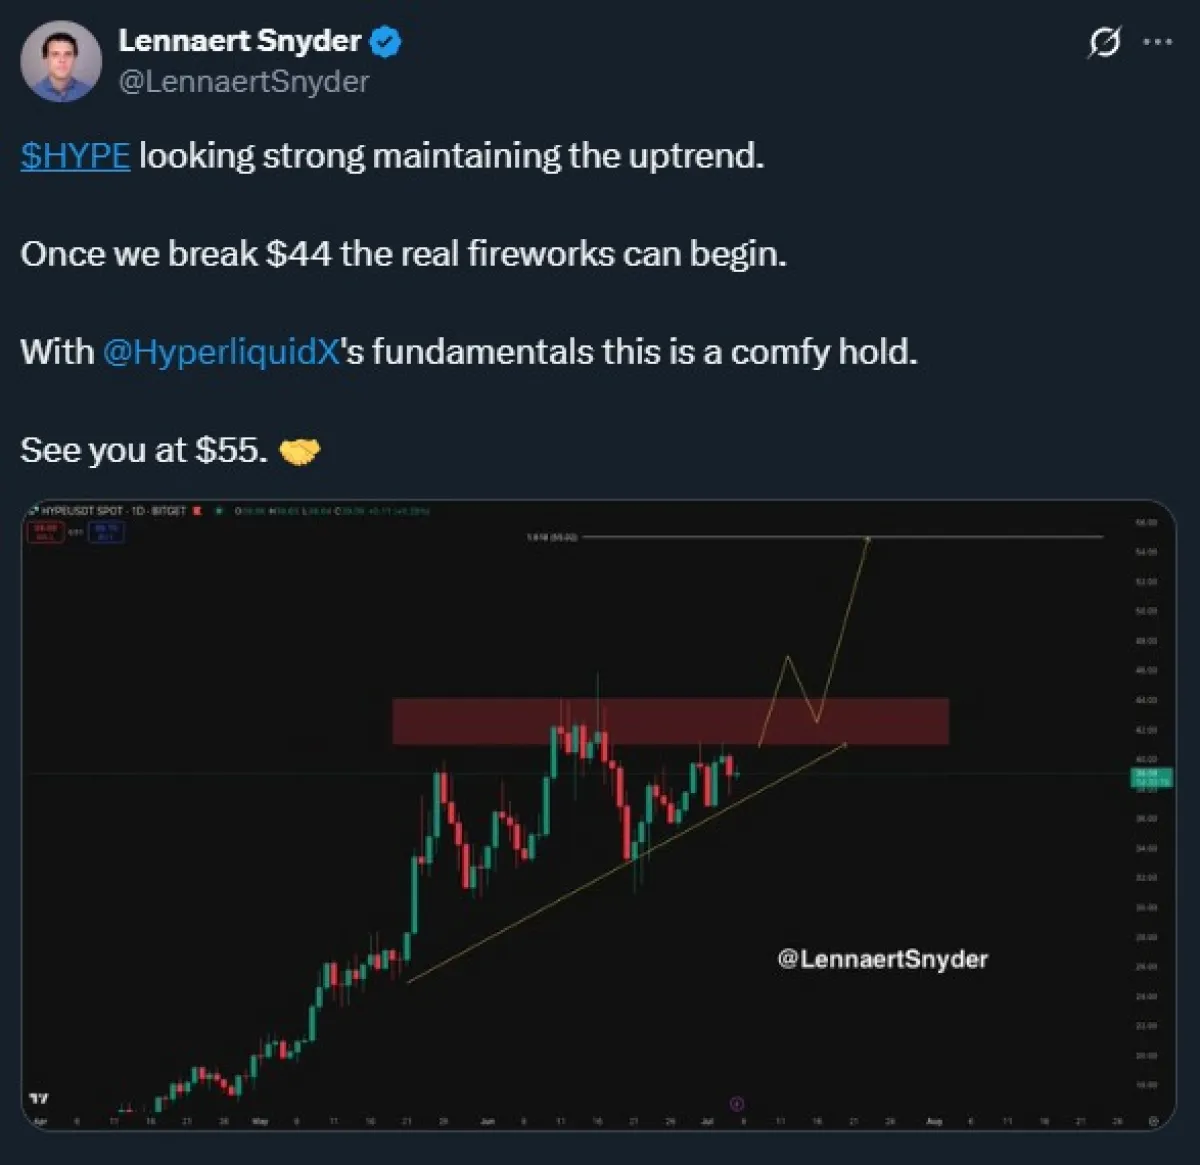
Meanwhile, another expert shared a similar prediction. In a post, the expert noted that HYPE is looking strong and maintaining its uptrend.
Additionally, he outlined a condition for the upside rally, stating that once the price breaks above the $44 level, the real fireworks could begin, potentially pushing the price toward the $55 level in the future.
HYPE Price and Volume Drops Sharply
At press time, HYPE was trading near $38.91 and had recorded a price drop of 1.25% in the past 24 hours. Considering the overall market structure and the asset’s struggles over the past few days, trader and investor participation has declined.
Data from CoinMarketCap reveals that HYPE’s trading volume during this period has dropped by 30%. This fall in the trading volume indicates a lack of interest and confidence in the asset compared to the previous day.
HYPE Coin Price Action and Key Levels to Watch
According to expert technical analysis, the HYPE price appears to be forming an ascending triangle pattern, with a common resistance level at $43.
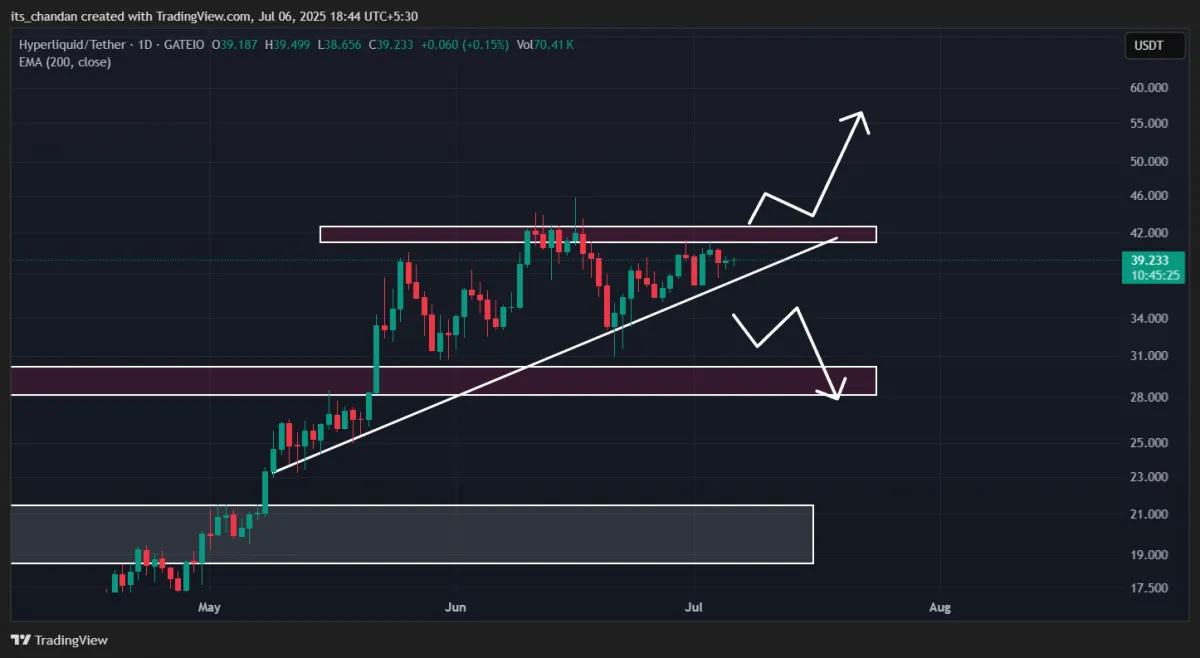
Based on recent price action and historical patterns, if the current market sentiment improves and HYPE breaks out of the ascending triangle, strong upside momentum could follow.
On the other hand, if sentiment turns bearish and the asset falls below the $36 level, HYPE could experience downside momentum, potentially dropping to the $29 level in the coming days.
Also Read: XRP Price Eyes $2.65 as Ripple Seeks U.S. Bank Charter
CoinGlass Data Reveals Strong Bullish Bias
Given the current market sentiment, intraday traders appear to be aligning with the bullish outlook, as they are strongly betting on the upside.
HYPE Long/Short Ratio Above 1
Data from the on-chain analytics platform CoinGlass reveals that HYPE’s long/short ratio currently stands at 1.0052. A ratio above 1 indicates strong bullish sentiment among traders. Additionally, the data shows that 50.13% of traders are holding long positions, while 49.87% are on the short side.
$1.99 Million Worth of Short Positions at Risk
Moreover, traders are overleveraged at $38.05 on the lower side and $39.60 on the upper side—levels that now act as key support and resistance for HYPE.
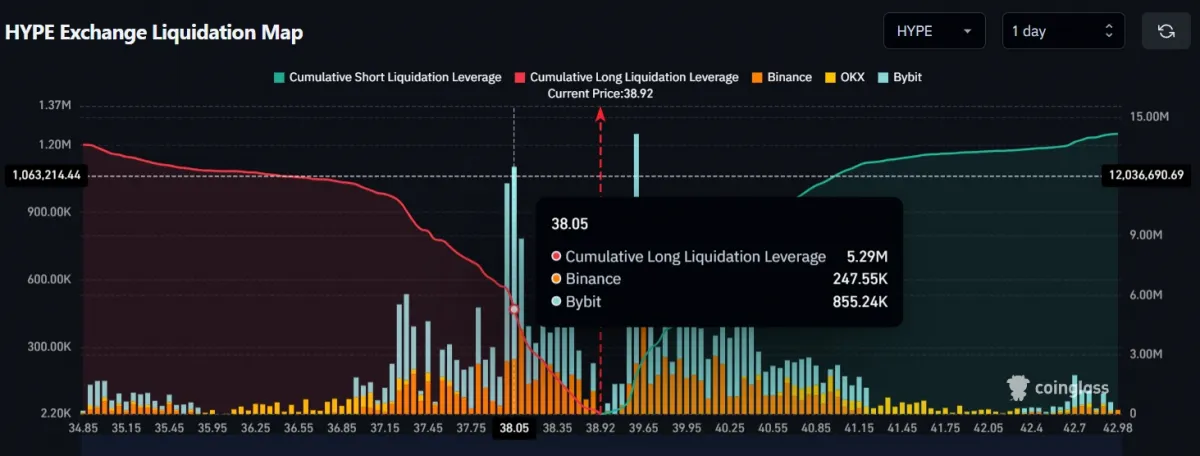
At press time, traders at these levels have built $5.29 million worth of long positions and $1.99 million worth of short positions, both of which are on the verge of liquidation.
If the overall market sentiment improves and the asset’s price rises to the $39.60 level, the $1.99 million in short positions could be liquidated.