Binance Coin Price surged past the $700 mark, reaching a high of $706.71 earlier today before slightly pulling back. The coin hovered between $690 and $697, signaling a renewed bullish sentiment among investors. This marked the first time in several months that BNB crossed the $700 threshold.
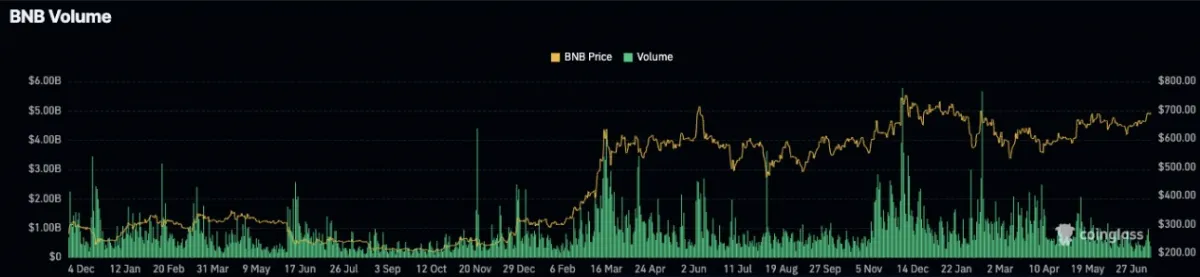
The price momentum followed notable developments within the BNB ecosystem. Increased investor interest and stable trading volume around $800 million supported the upward move. Binance Coin maintained its position as the fifth-largest cryptocurrency, holding a market capitalization above $100 billion.
Technical Analyst Views on Binance Coin Price
Technical analysts observed a series of higher highs and higher lows, indicating a strong bullish structure in the short term. An ascending triangle appeared to be forming on the chart, hinting at the possibility of a breakout. The $710 resistance level remained crucial, with potential targets set at $793 previous ATH, and $1,000.
Market watchers closely monitored the price action for confirmation of this breakout. The current structure suggests that, if backed by volume, BNB could soon move into a stronger upward phase. Analysts also noted that recent retracements were minor, supporting the bullish case.
Binance Coin recently marked its eighth anniversary. The token’s journey from $0.06 to nearly $700 highlighted its significant growth. This rise was supported by increasing trading activity and strong investor confidence.
BNB’s technical setup and historical strength pointed toward a promising path ahead, provided the bullish momentum continued beyond key resistance levels.
Binance Coin Price Shows Strength Amid Renewed Uptrend
A crypto analyst pointed out a bullish trend in the Binance Coin price on the weekly chart, with a continuing uptrend that started in February 2024. Although it has experienced some moderation in recent months, the trend has remained persistent and is presently gaining momentum.
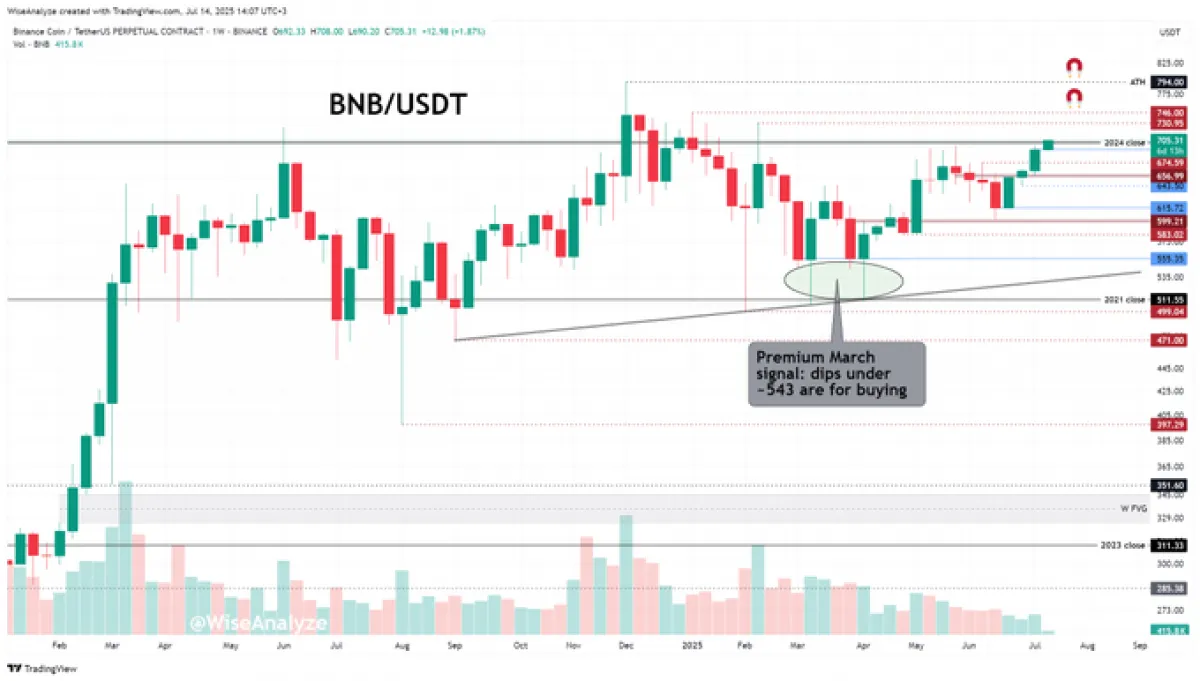
A possible breakout in a few weeks to come, an analyst hints that the market is re-entering a phase of activity.
As pointed out in the analysis, BNB stands a chance of overcoming resistance close to $730 and $746.
Bullish sentiment is also supported by the fact that analysts mentioned that lows below the amount of $543 are regarded as good buying opportunities earlier in the year. The market sentiment of BNB keeps getting better and better with increasing volume and stable support.
BNB Derivatives Market Sees Massive Surge in Trading Activity
The derivatives market of BNB shows a magnificent surge, where the trading volume jumped by an acute 188.56% to $1.05 billion.
This strong comeback underlines a new interest of investors and elevated activities on the markets of BNB-related futures.
The figure of open interest, which indicates the amount of open contracts in value, increased by a small margin of 3.54% to reach $847.47 M.
The options segment recorded remarkable activity. The volume of options increased by a whopping 956.68 percent to 5.37 million, amounting to an increase in speculative positioning.
The options open interest also increased significantly by 26.17 to stand at a figure of $11.49 million. These numbers are indicators in the rise of market participation and possible volatility in the future of BNB.
Will Binance Coin Price Rally Past $710?
BNB price faced rejection near the $707 resistance, slipping to $689.62 by the close of the day’s session. The dip occurred despite the coin trading within an ascending channel over the past few weeks, suggesting a possible shift in sentiment.
The Relative Strength Index (RSI) was at around 65, which was closing on the overbought zone, and it indicated that it would be turning to the downside.
The MACD indicators remained bullishly divergent. But the histogram began to flatten, and the MACD line drew nearer to where the signal line was showing signs of a bearish crossover, when selling pressure intensifies.
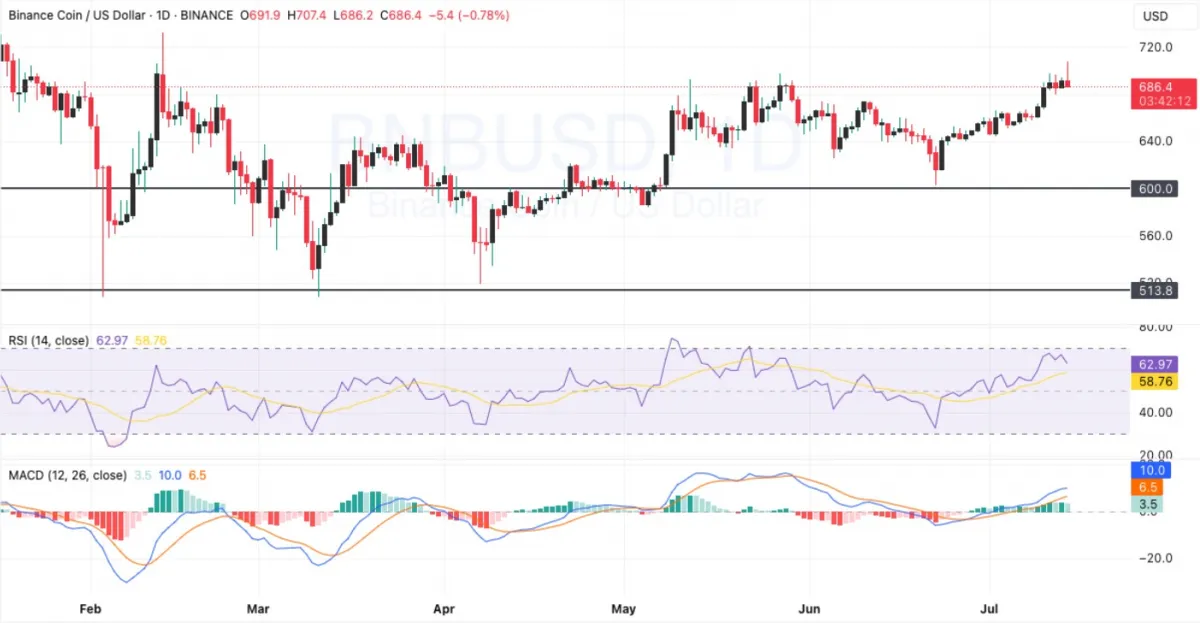
BNB found short-term support around the $680 mark. If this level fails to hold, the price could retrace towards $650 or even test $625.
Conversely, if bulls regain control and break above $707, the next key resistance would be around $725. A successful breach could push the price further toward the $750 mark in the coming weeks.