Skip to content
News
Guide
Top 5
Price Prediction
News
Guide
Top 5
Price Prediction
Author:
admin
Tron Price Rallies as Tron Inc. Unveils $1 Billion TRX Purchase
7 months ago
admin
Best Altcoins for 2025: 5X to 10X Crypto Gems Revealed
8 months ago
admin
XRP News Today: $20.96B Upbit Volume Boosts XRP Momentum
8 months ago
admin
Solana Price Prediction: Analysts Eye $105–$130 as Critical Support Zone
8 months ago
admin
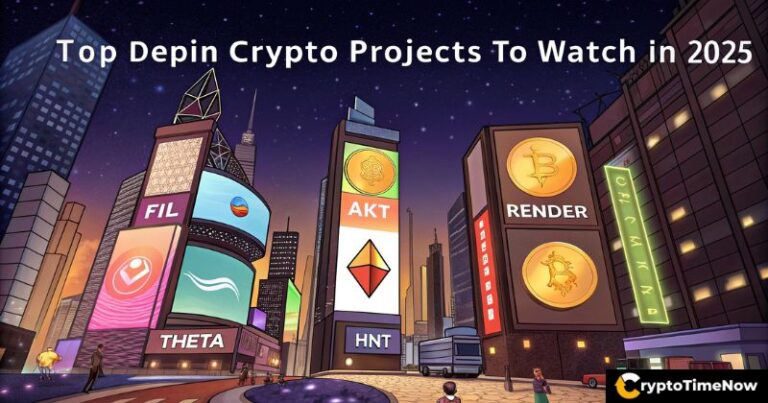
DePIN Crypto for Beginners: What It Is and Why It Matters in 2025
8 months ago
admin
Why Crypto Launchpads Are a Goldmine for Early Investors
8 months ago
admin
Shiba Inu Price Crashes 35%, But a 70% Rebound Could Be Next
8 months ago
admin
Is GME Stock Still a Buy in 2025 After Its Bitcoin Pivot?
8 months ago
admin
XRP News: Ripple Pushes Settlement Path Towards SEC Case
8 months ago
admin
Dogecoin (DOGE) Rally Imminent? Chart Flashes Bullish Divergence
8 months ago
admin
No posts found