Altseason Incoming? – Recent developments in the Total3 market cap chart indicated a possible change after months of sideways movement. Consequently, a technical repeat could be setting up an altseason.
224-Day Consolidation Followed by Altseason Breakout
Analyst Trader Tardigrade identified a repeating pattern in the Total3 chart. The pattern measures the total market capitalization of all cryptocurrencies, not including Bitcoin or Ethereum.
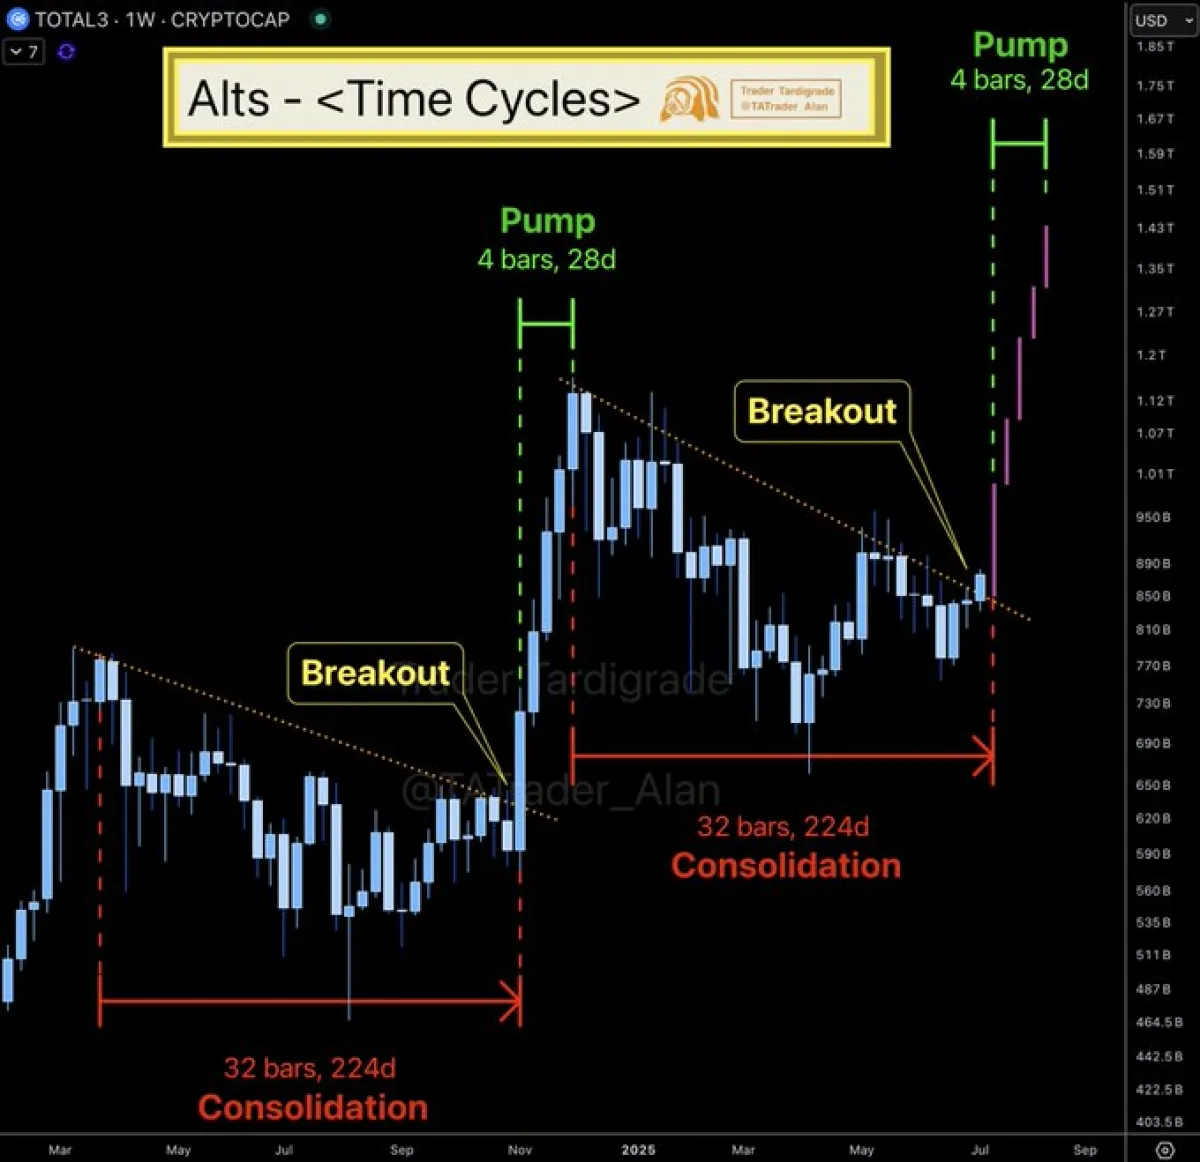
According to the weekly data, the altcoin market has undergone two complete cycles of 32 bars or 224 days of consolidation. Both prior cycles were followed by strong bullish trends lasting four weekly bars, equivalent to 28 days of upward momentum.
In addition, the current cycle has completed its third 224-day consolidation phase and has just posted a breakout candle on the weekly chart. The similarity in duration and structure between all three patterns adds technical weight to this development.
If the historical rhythm continues, the next four weeks may experience increased volume and a rise in Total3 valuation, consistent with the past altseason cycles.
Cup and Handle Pattern Suggests Larger Upside
In a separate analysis, Carl Moon identified a more macro interpretation on a weekly chart that showed the classic cup and handle pattern. The structure is considered a long base and then a breakout pattern. The cup runs from mid-2022 to late-2024 with a neckline slightly below the $1.3 trillion mark.
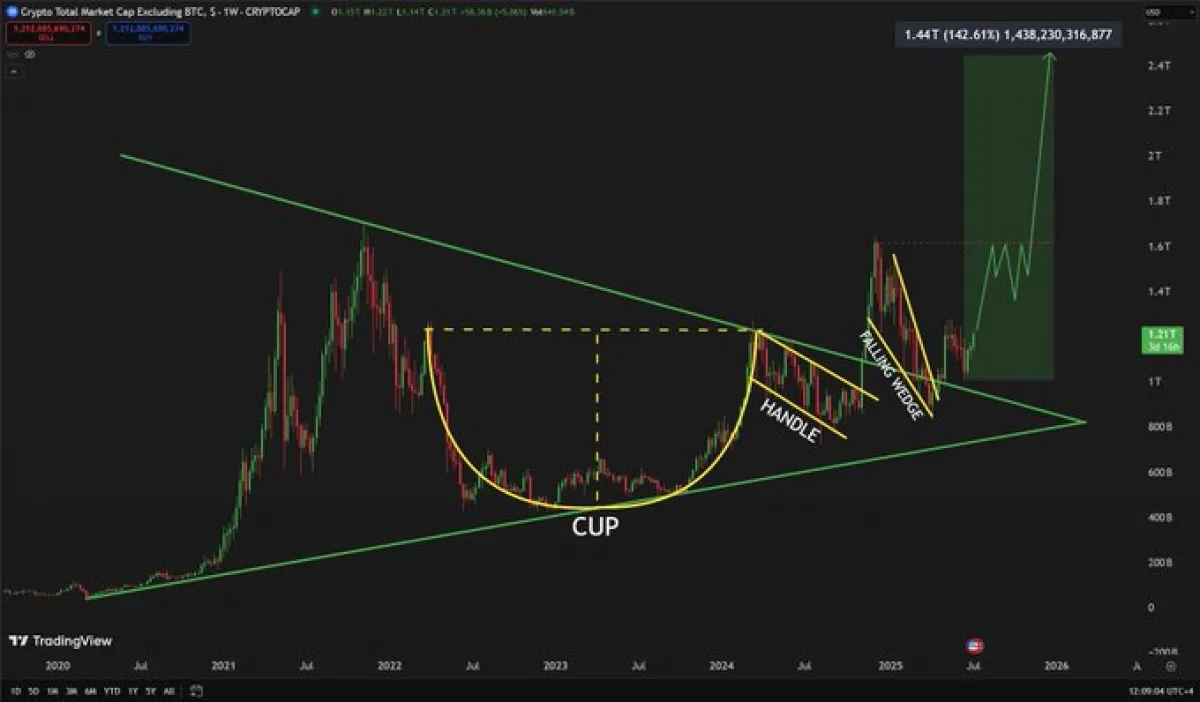
Moreover, the falling wedge formed the handle part and ended at approximately the same neckline. Such a falling wedge has seemingly toppled upwards, and it coincided with the occurrence that was breaking out a current 224-day cycle.
The projected measured move of this pattern would bring the Total3 market cap close to $2.4 trillion. This suggests the recent upward move could be part of a much broader structure that has been forming over the last two years.
Falling Wedge Confirms Breakout Structure
More so, the falling wedge that is evident in the chart of both Carl Moon and Trader Tardigrade started following the neckline rejection in late 2024. It collapsed into lower lows and lower highs in multiple months, providing a narrowing formation common to preceding trend changes.
As of this week, the breakout above this wedge coincides with rising volume and reclaimed support above the $1 trillion zone.
This wedge breakout, combined with the time-based consolidation cycle, may add technical confirmation for short-term bullish expectations. The alignment of two independent chart structures, the time cycle and falling wedge, reinforced the possibility that a 28-day pump phase could now be active.
Also Read: PEPE Coin Price Eyes 35% Rally After Bullish Breakout
Bitcoin Pumps as Dominance Drops Sharply
Another analyst, Ash Crypto, observed that Bitcoin has been in a sharp surge as BTC dominance declined. According to the 2-hour Bitcoin/USDT chart, a strong break to over $111K was noted, and this implied a new wave of buying pressure.
Subsequently, this movement often creates favorable conditions for altcoins to gain relative strength in the short term.
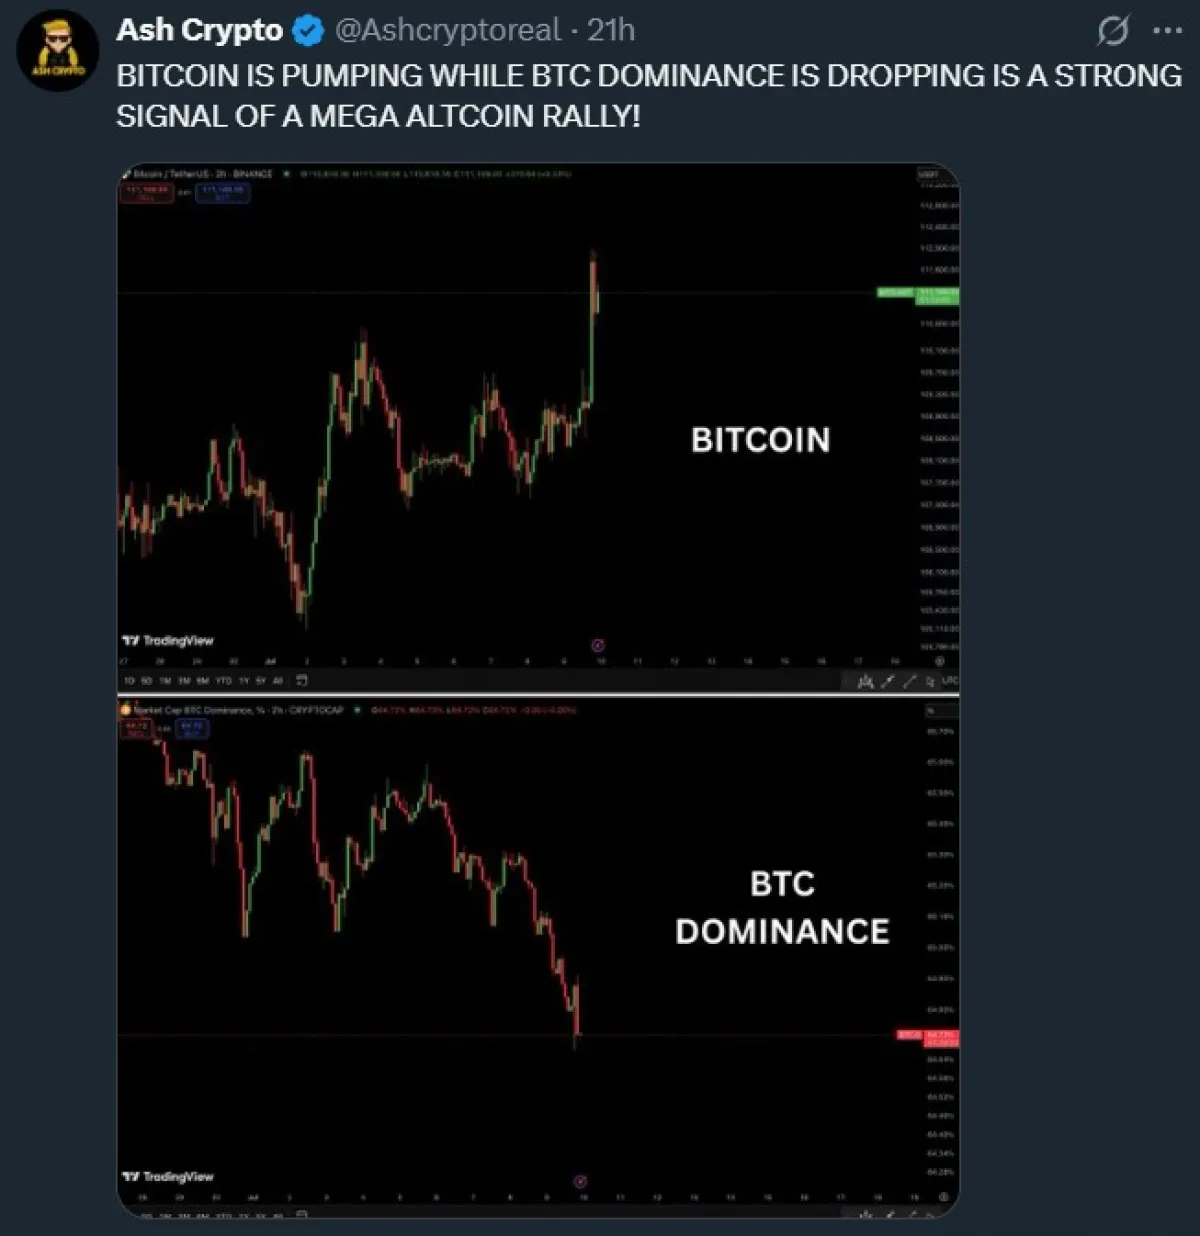
Furthermore, the BTC dominance chart revealed a drop to approximately 64.72%, which has breached recent support. This implied that capital was circulating to altcoins at the same time that Bitcoin was gaining. The relative movement in both BTC pricing and its declining dominance might be a sign that altcoin rallies are in their early phases.
Meanwhile, recent analysis indicated that Bitcoin dominance has dropped below 64%, triggering renewed speculation of an emerging altseason. As capital rotated into Ethereum and altcoins, analysts observed rising trading volumes and leveraged positions across non-Bitcoin assets.
Historical altcoin-to-BTC ratio patterns also pointed to a possible repeat of past breakout cycles, suggesting broader market participation.