
Floki crypto pointed out technical indications of stability following a deep decline. The recent charts indicate different periods, although all suggest that the asset is reaching a crucial stage of consolidation that could break out in the upward direction. Among classical chart patterns, key support/resistance areas, and momentum indicators, analysts have indicated a mix of factors that point towards this outlook.
Floki Crypto Eyes Breakout Amid Resistance
According to analyst TimelessBeing, Floki crypto transitioned into an accumulation phase following a sustained downtrend. FLOKI price has been consolidating within a well-supported demand zone between $0.00000500 and $0.00000700, an area with high historical volume.
Further, the analyst pointed out that the Floki crypto price is close to a major dynamic resistance, which is probably a 200-period moving average or VWAP line. This midline, which is being tested on the lower side, will become crucial in the validation of a bullish reversal should the price break and hold above this midline.
More so, the chart was characterized by a tight consolidation pattern, in the form of a bullish continuation flag, which indicated a possible upward momentum if confirmed.
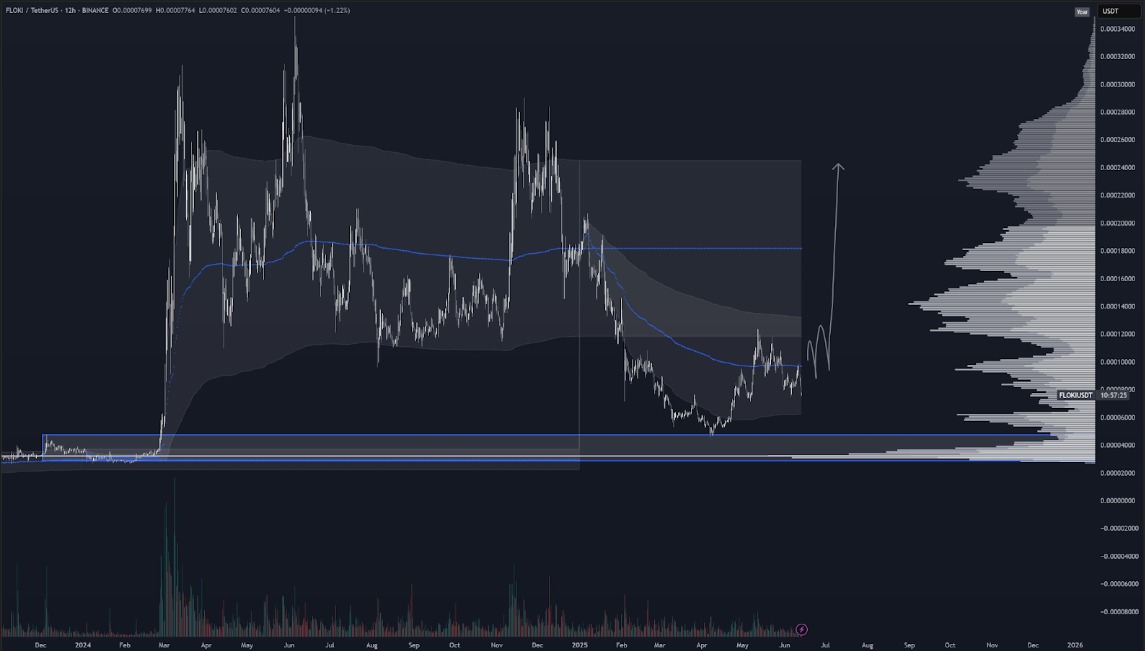
In addition, volume data adds further weight to the analysis. A steady increase in trading volume since May 2025 indicated renewed market participation, even if not yet at historical peaks. The presence of a visible volume gap above the current price range could accelerate any potential breakout.
Double Bottom Pattern Signals Possible Reversal for Floki Crypto
Furthermore, analyst Crypto_Jobs identified a possible FLOKI crypto bullish reversal structure known as a classic double bottom pattern. Floki price has retested the support level twice; first on June 6 and then on June 13, creating an almost perfect-looking double bottom formation. This trend is an indicator of exhaustion of a trend and a potential reversal.
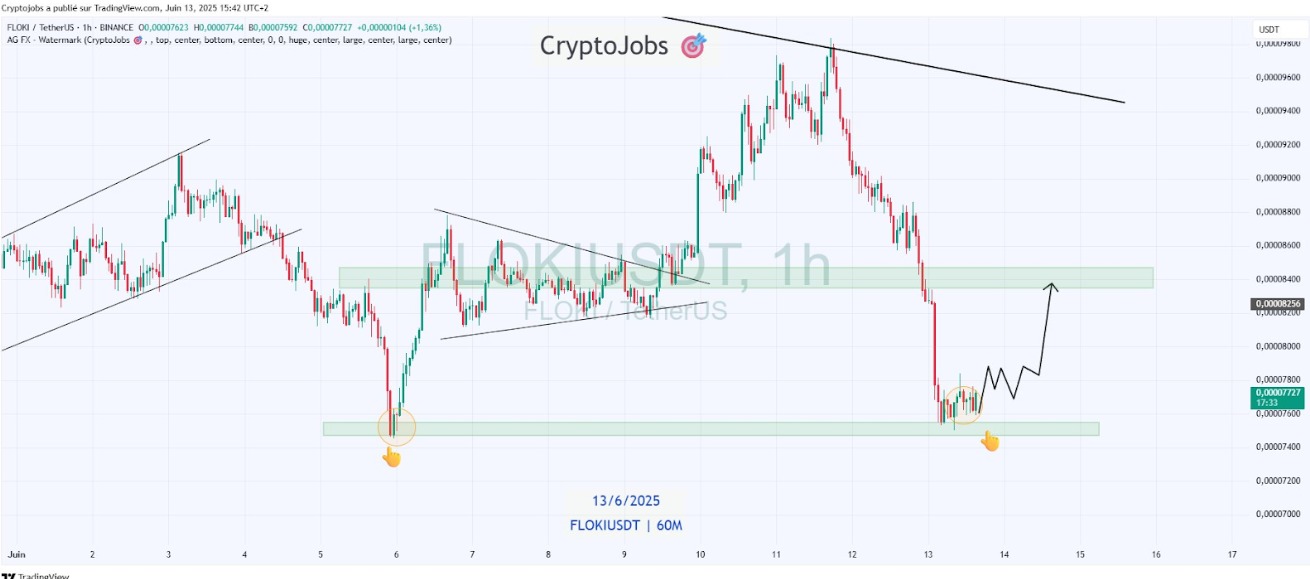
Additionally, support has held firm, evidenced by quick buying responses on both dips. According to the analyst, the formation of small-bodied candles near this demand zone signals a tightening of the Floki price range and a potential buildup for a breakout. The chart projection anticipates a recovery move toward the resistance zone, a level that previously acted as a supply zone.
In addition to the FLOKI crypto price structure, the analyst noted a bullish RSI divergence at the second bottom. While not displayed on the chart, the referenced RSI behavior, where Floki price makes a lower low but the RSI prints a higher low, indicates a weakening bearish momentum. This divergence supports the short-term forecast of a possible reversal if the Floki price maintains its position above the key green support zone.
Also Read: Shiba Inu News: SHIB to Crash or Explode 17x?
Floki Price Stabilizes After Downward Pressure
Besides, another analyst reflected on ongoing bearish pressure but showed signs of potential Floki crypto price stabilization. After a sharp rejection at the $0.00009500 area, Floki price moved well below the 20-period simple moving average, which is regarded as the midline of the Bollinger Band.
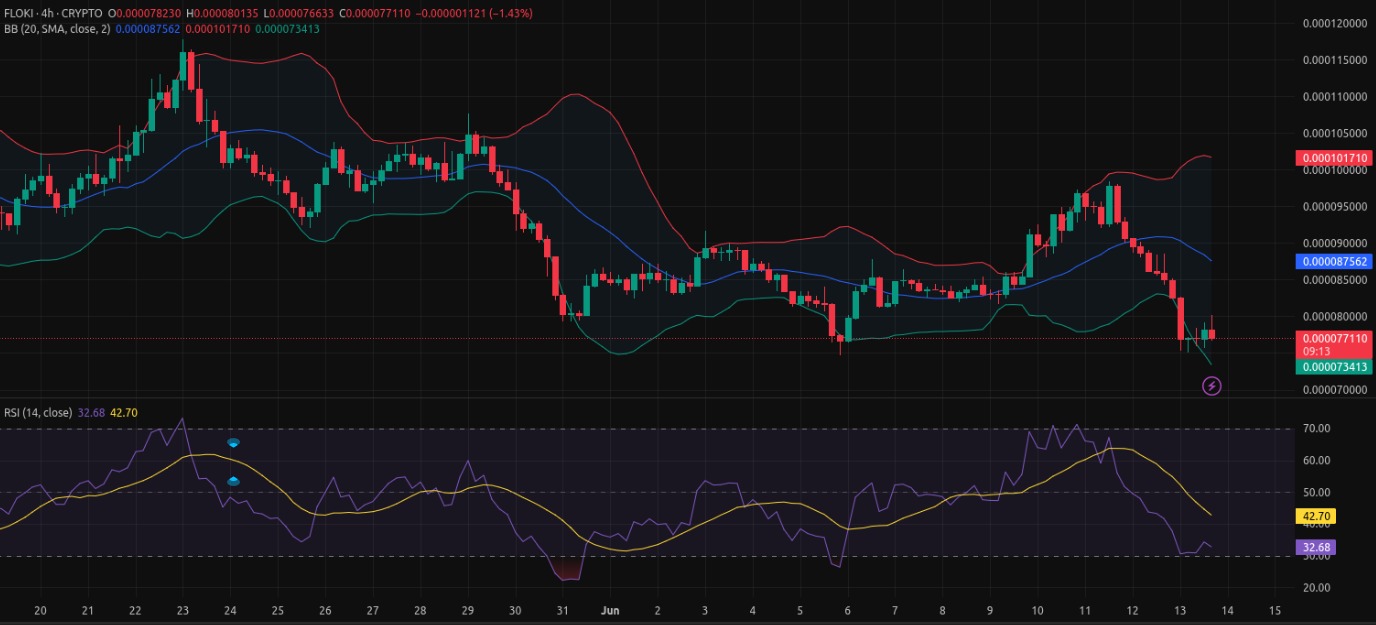
Based on this analysis, the convergence of the Bollinger Bands after a series of steep declines shows a rest in the directional movement. Smaller candle bodies with lower wicks suggest reduced selling pressure and early buying interest. For any bullish movement to materialize, FLOKI price must reclaim the midline.
The RSI on this chart also adds weight to a short-term reversal situation. Having recently recovered from dropping below 30 to its current value of 34.91, the indicator remains in bearish territory as it attempts a recovery.
Also, a minor bullish divergence suggested that the bearish momentum is weakening. The moving average of the RSI, which was previously at 40.41, is leveling off, indicating that the market sentiment is turning slightly bullish.