XRP has broken above its historical resistance and placed its market cap above that of McDonald’s. With a current price of $3.62 and a market cap of $214.19 billion, XRP now ranks among the top 80 global assets, ahead of companies such as McDonald’s and Shell.
XRP Price Surges After Breaking Long-Term Resistance
XRP has just broken out of its former all-time high around $3.30 and is now turning this resistance into a new support area. According to market analyst Formanite602, this structural shift suggests a bullish continuation as long as the asset maintains price levels above the breakout point.
The technical setup reveals that XRP is consolidating at the $3.30-3.60 level and is awaiting a probable rise. Formanite’s analysis points to a possible upside target of $4.52 based on the 1.618 Fibonacci extension of the recent price rally. Price action continues to form higher highs and higher lows, a standard sign of an uptrend holding.
Technical Patterns Point to $4.52 and $6.12 Targets
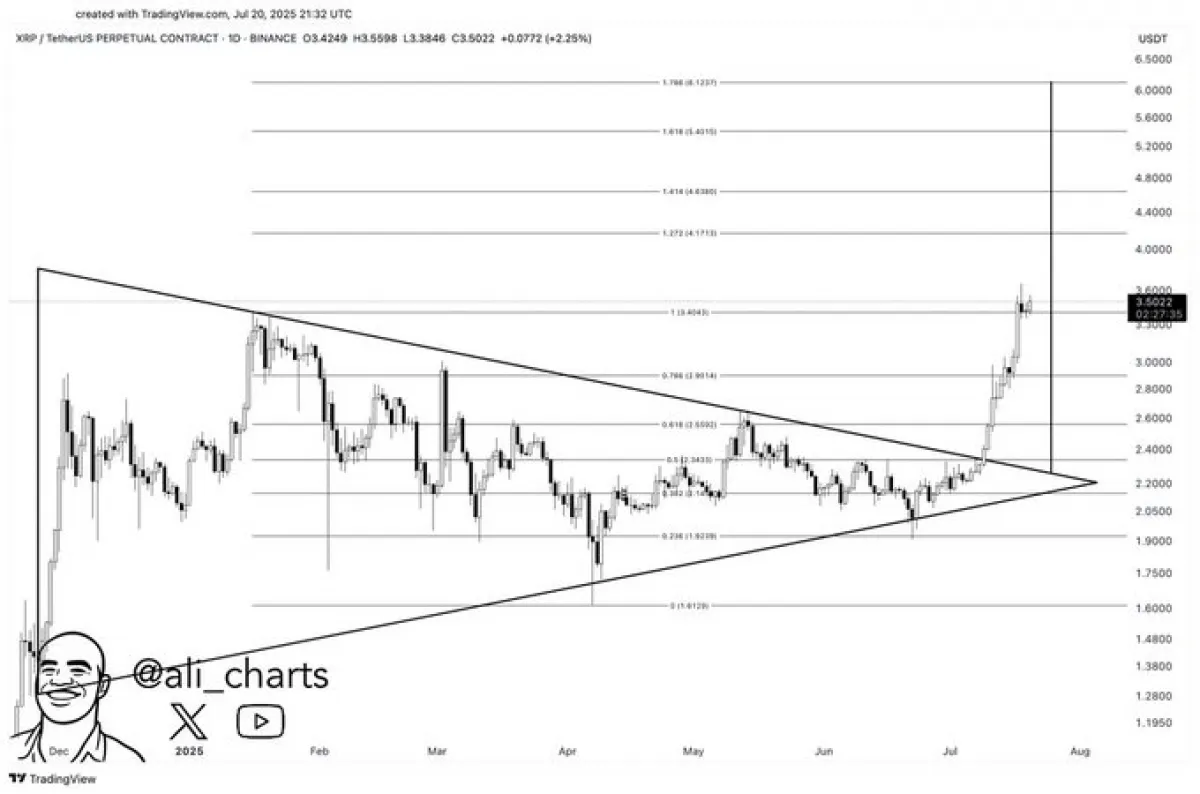
The daily chart presents two possible continuation patterns. One way is consolidation in the price range of 3.30-3.80, and the second hints at a direct breakout to higher resistance areas. The current rally is being watched closely by analysts near the $4.52 price level that aligns with the 1.618 Fibonacci extension.
According to a Crypto expert, XRP broke out of an extended symmetrical triangle pattern that developed from late 2024 to mid-2025. These projections indicate that the price may rise higher due to that breakout and a long-term target of about $6.12, assuming the continuing momentum. The symmetrical triangle pattern and the breakout have generally been inclined towards bullish continuation patterns. Price holding above the $3.00–$3.20 zone is key for the move to remain valid.
XRP Surpasses McDonald’s in Market Valuation
XRP’s market capitalization has now reached $214.19 billion, surpassing McDonald’s, which has a market capitalization of $211.73 billion. It now sits just behind American Express and ahead of Intuit and Shell in total valuation.
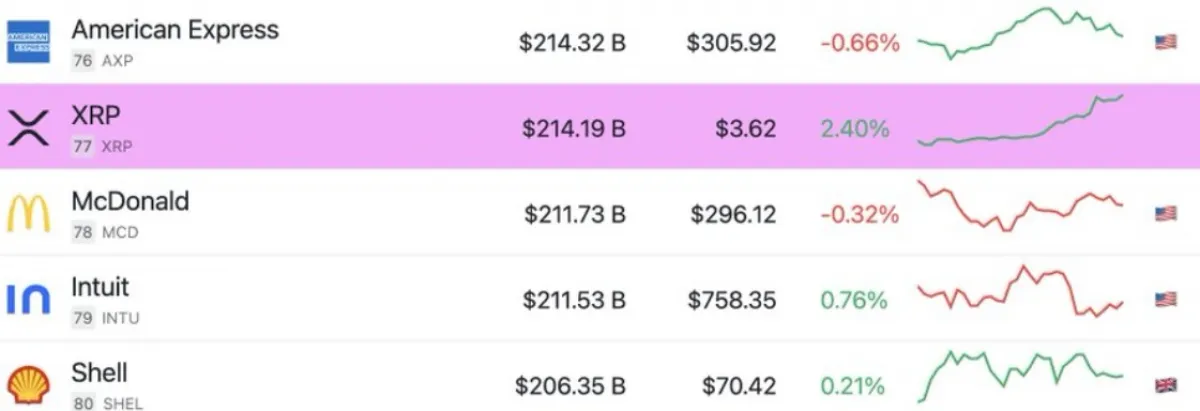
Its price performance has also outpaced many S&P 500-listed equities. With a +2.40% daily gain and a clear upward price trend, XRP has caught investor attention during a broader period of digital asset strength. Meanwhile, firms like McDonald’s and American Express posted small daily losses of -0.32% and -0.66%, respectively.
Also Read: What is DeFi Staking? How It Works and Top Platforms in 2025
On-Chain and Momentum Indicators Signal Caution
Technical indicators are also suggesting possible short-run exhaustion, where the overall trend remains bullish. The recent price trend of XRP of $3.6078 is close to the upper band of the Bollinger at 3.73, meaning that the price can be overbought.
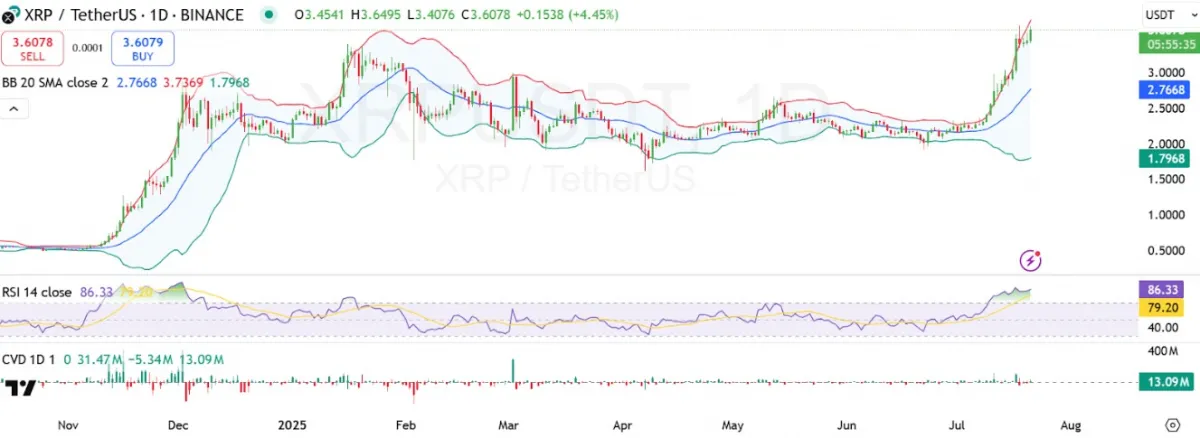
The RSI of 86.33 indicates very strong buying momentum, but the asset is also in the very overbought zone. What the history of these RSI levels has indicated is potential cooling off or pullbacks.
The strength behind the move is supported by Cumulative Volume Delta (CVD) readings of +13.09 million, which demonstrate a positive buy inflow. However, earlier volume data reveals moments of hesitation, pointing to the importance of monitoring volume strength in the coming sessions.
Market Cap Growth Reflects Renewed Investor Confidence
Since the close of June in 2025, the market capitalization of XRP has surged considerably. In recent weeks, the token value increased dramatically, going to the point of $215 billion, where it was in a consolidation range of between 125 billion and 160 billion earlier in the year.
This surge began after months of sideways price action. The breakout from this consolidation zone suggests strong investor participation. Institutional and retail inflows have likely contributed to the volume spikes seen during this breakout period.