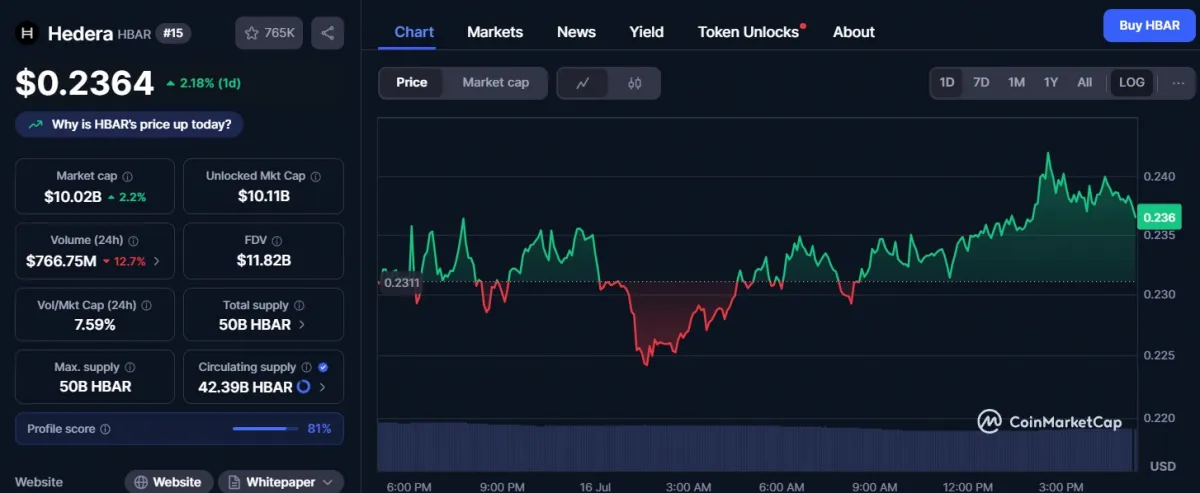
For the past couple of days, Hedera (HBAR) has been trading sideways near a key resistance level of $0.26. As per the daily chart reveals that this is the second time the asset has approached this level.
The last time it reached this point, it recorded a significant 50% price dip, which now raises the question history will repeat itself, or will a breakout occur?
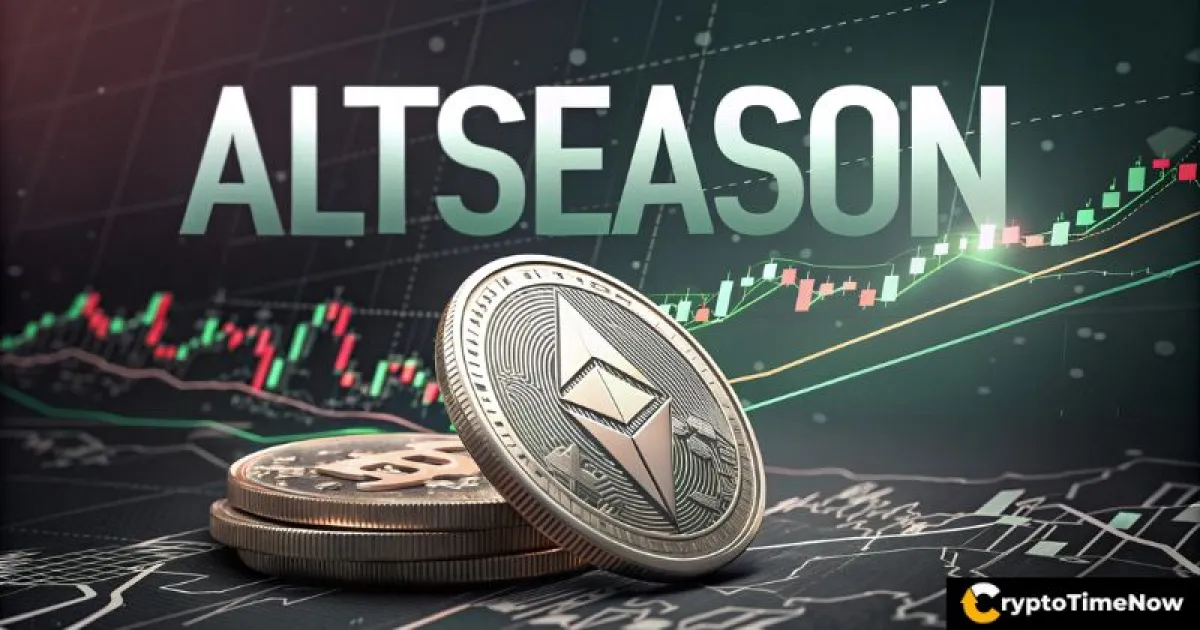
HBAR approaches key level amid mixed sentiment
Given the current market sentiment and the ongoing price correction across the crypto landscape, this level has become a make-or-break situation for the asset.
At press time, HBAR is hovering near $0.237, having climbed over 2.5% in the past 24 hours. As the price approached the key resistance level, trader and investor participation initially dropped, leading to a 20% decline in trading volume.
However, this decline in volume has gradually reversed, suggesting that participation in the asset has surged, indicating strong upside momentum.
According to CoinMarketCap, HBAR’s market sentiment is bullish in the short term, potentially driven by ETF speculation and enterprise adoption. However, overbought signals from the RSI and the current resistance level warrant caution.
Also Read: Standard Chartered Opens BTC & ETH Spot Trading for Institutions
Bullish on-chain metrics fuel confidence
Despite fears of a potential correction, traders appear to have a bullish outlook as they are strongly betting on long positions.
Data from CoinGlass reveals that the Binance HBARUSDT long/short ratio has reached 1.94, indicating strong bullish sentiment among traders. Moreover, the data shows that 66.02% of traders on Binance are currently holding long positions, while 33.98% are in short positions.
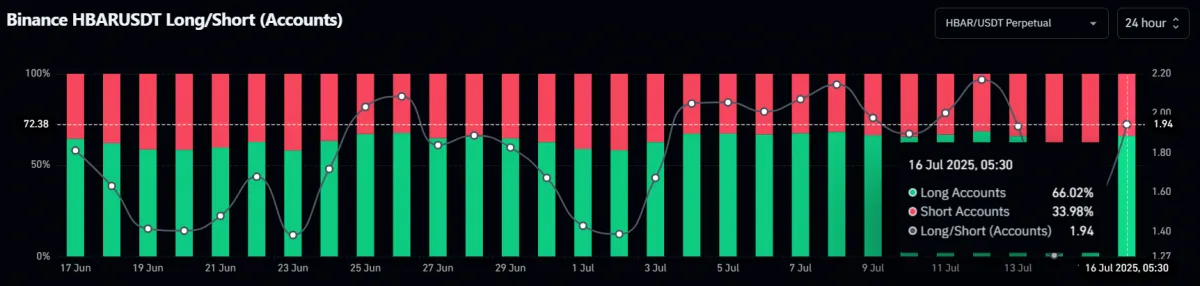
Meanwhile, investors have also shown interest and confidence in the token, as reflected by their accumulation over the past 48 hours.
Data from CoinGlass reveals that over $4.48 million worth of HBAR has been withdrawn from exchanges during this period. This outflow amid the correction suggests potential accumulation, which could create buying pressure and help the asset breach its key resistance level.
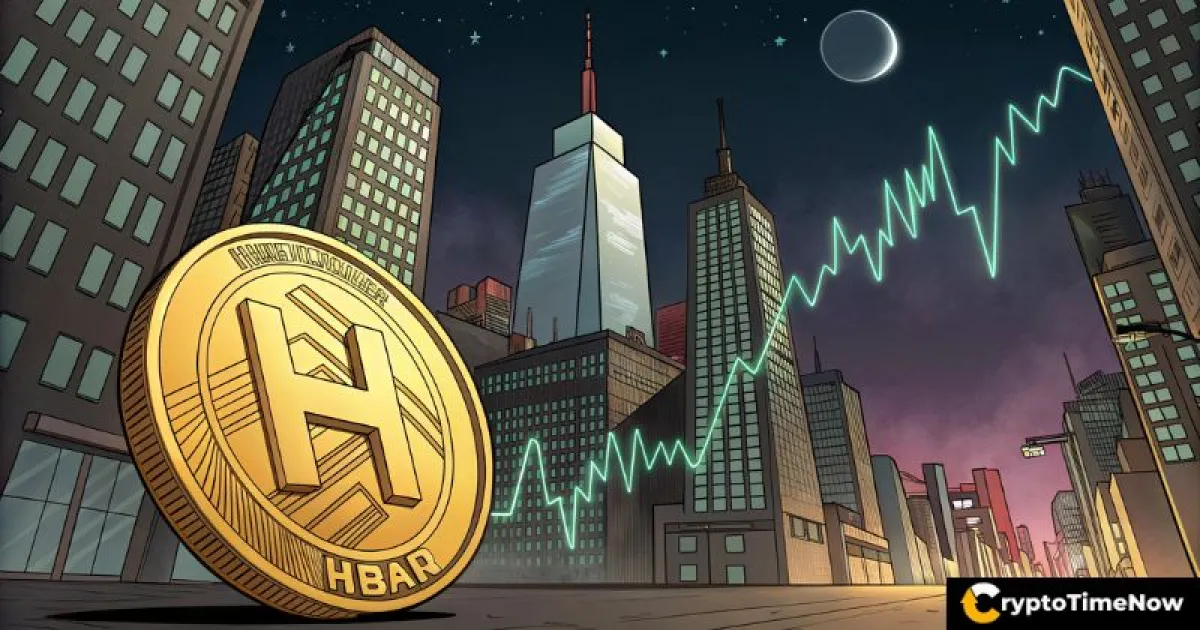
HBAR technical setup signals potential breakout
Cryptotimenow’s technical analysis reveals that HBAR is inching closer to a potential massive price uptick.
According to the daily chart, the asset has been consolidating in a tight range near the key resistance level of $0.26. This ongoing consolidation may indicate potential accumulation, as whales and investors often use such zones to accumulate before a rally begins.
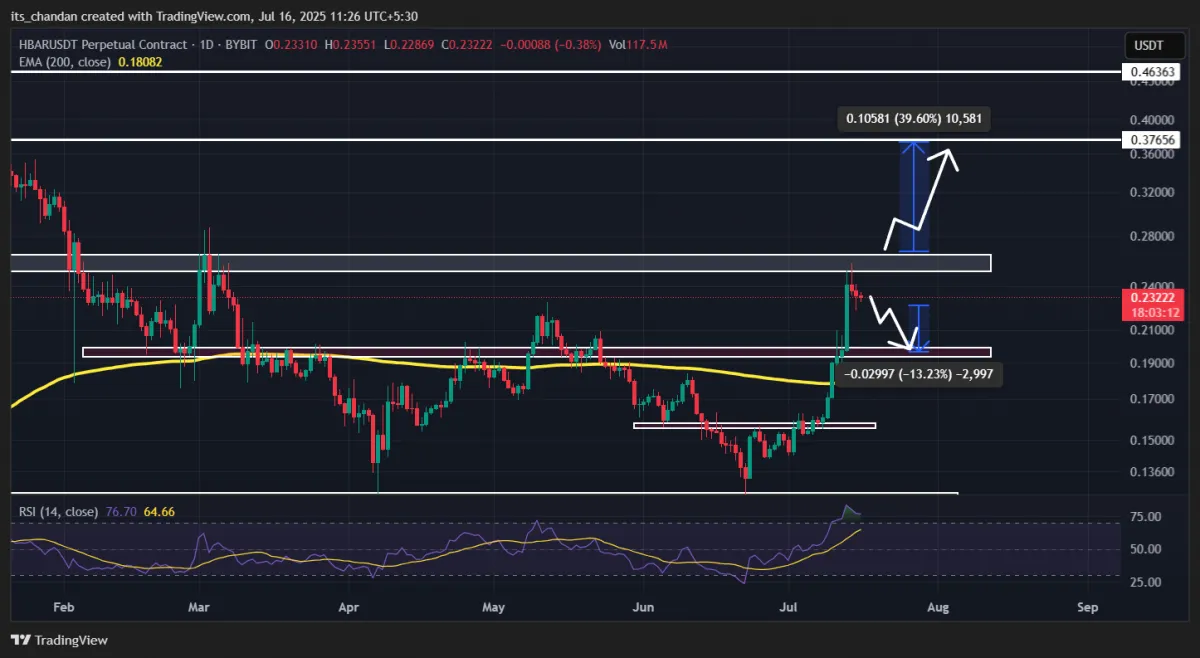
Based on recent price action and historical patterns, if HBAR closes a daily candle above the $0.265 level, the asset could surge by 40% and potentially reach the $0.37 level.
On the other hand, if the current consolidation breaks down, the price could dip by 13%, pushing HBAR down to the $0.22 level.
At press time, HBAR is trading above the 200-day Exponential Moving Average (EMA) on the daily timeframe, indicating that the asset is in an uptrend.